Welcome to part one in a three-part series taking marketers on a journey to creating a data-driven culture. In this series, you’ll learn how to design a data-fueled marketing strategy that removes the gut check from decision making and enables hyper-relevant marketing at a global scale.
When opening a new puzzle box, hundreds of disconnected pieces of all shapes, sizes and colors fall onto the table. Each puzzle piece is distinctly unique yet, with dedicated time and effort, they harmoniously fit with one another and a cohesive masterpiece emerges.
If the bits of data within your organization were puzzle pieces, would they fit together as nicely? I’m guessing your answer is “no.” In fact, if you’re like me, you’ve probably been trying to coerce these pieces together for years, like a frustrated child forcing unfitting puzzle pieces into place.
According to IBM, 90 percent of the data in the world today has been created in the last two years. Every second, 40,000 search queries are ran on Google alone. The possibilities with the vast volume of data are endless and span across every innovation, development and life on this earth today.
“90% of the data in the world today has been created in the last two years.”
This data revolution represents the greatest paradigm shift in marketing since the invention of the internet. There is too much knowledge available to justify making any decision that is not data-driven. Going with your gut, taking uneducated guesses and making assumptions are a thing of the past. To quote the great, W. Edwards Deming, “without data you’re just another person with an opinion.”
“Without data you’re just another person with an opinion.
— W. Edwards Deming
For marketers, this magnitude of data can feel overwhelming and often paralyzing. What should you be looking for and what can you ignore? How does it all tie together? How can I derive actions from these insights?
The first step to understanding your data is gathering it. And, the first step to gather your data is to create what I call, an attendance sheet.
Create a Data Attendance Sheet
The metrics that you choose to measure will affect what types of data you’d like to pull and from what sources. For example, an eCommerce company might be interested in measuring the repeat revenue of customers who have made purchases, whereas a SaaS company might be interested in monitoring customers at-risk of canceling their subscription.
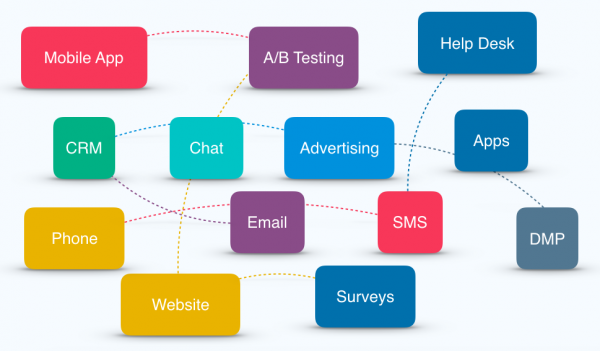
After defining the key metrics that matter most to your organization, it’s time to create an attendance sheet. The attendance sheet includes all of the data sources and actions that you will pull to help measure these metrics. To start, identify the various tools your company uses that could be holding valuable data. See the below image as a reference:

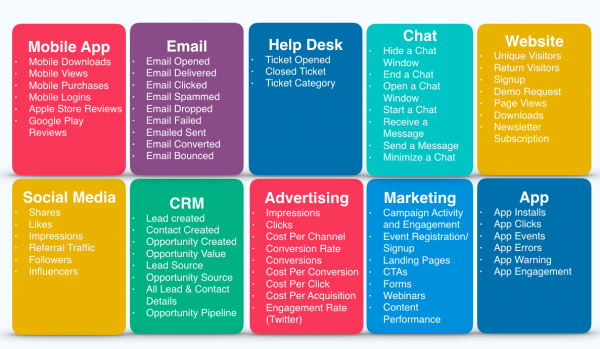
Next, outline the unique actions that you’ll be tracking within each source. For example, for my Live Chat solution, I’ll be monitoring when visitors:
Hide a Chat Window
End a Chat
Open a Chat Window
Start a Chat
Receive a Message
Send a Message
Minimize a Chat Window
The goal of this exercise is to develop a comprehensive list outlining the different types of data that you can pull from all sources. It doesn’t matter if you don’t know what you would do with the data today. You may have a need for it in the future so be as specific and thorough as possible.
Here’s an example of what a completed attendance sheet could look like for a SaaS B2B company:

Your finalized attendance sheet could be much longer or shorter depending on your business, but the key is to find and record as many different existing data points within your organization as possible. This will open up the door for greater intelligence into your customers and create a dynamic pool of information that insights can be extracted from.
“One of the reasons for failure is that the knowledge-creating system, the method by which humans collectively learn and by which institutions improve themselves, is deeply fragmented.”
Peter Senge and Daniel Kim
Conduct a Data Roll Call
Now that you have an attendance sheet breaking down all of the various prospect and customer touch points within your company, it’s time to ensure the data is accessible to you. I like to call this conducting a Data Roll Call.
Remember the scattered puzzle pieces mentioned before? If the puzzle pieces represent the data, the attendance sheet and roll call are the organization of that data. Just as you might start to separate and bucket puzzle pieces based on their size, coloration and shape, so too should you prepare your data points and sources before trying to make them all fit together.
“Prepare your data points and sources before trying them make it all fit together.”
In this step, you’ll ensure the data you need is accessible. To succeed in creating a data-driven culture, all departments must be aligned: those who enable access to the data and those who consume the data. Do you have access to your application metrics? Do you know how many support tickets are opened each day? Are you able to see the opportunities in the pipeline and the campaigns that are driving those opportunities? If you find yourself thinking that not all of this information is relevant to a marketer, I know some very successful companies that would disagree.

Making data accessible company-wide is the most crucial step in creating a data-driven culture.
Think about the businesses that have dominated their industries over the last five years. Uberrevolutionized the taxi industry and yet, they have no taxis. ThredUP is the largest consignment and thrift store and yet, they have no stores. AirBnB is now valued at $30 billion. That’s more than the world’s leading hotel company, Hilton Worldwide Holdings, valued at $23.4 billion. And yet, they have no hotel rooms. What’s the common theme? Data. Today’s disruptors live and breathe data in every way possible.
“Making data accessible company-wide is the most crucial step in creating a data-driven culture.”
The companies that follow this theme will be the future leaders, the groundbreakers, the survivors and the industry-shakers. What’s even better, you don’t have to be bringing driverless cars to market to see the impact that data accessibility can have. In fact, a study by Baseline revealed that for a typical Fortune 1000 company, a mere 10 percent increase in data accessibility would yield $65 million in additional net income!
“A mere 10% increase in data accessibility would yield $65 million in additional net income.”
If the potential for increased revenue isn’t a strong enough incentive, think about the dollars you’ll save by making better informed decisions and the valuable time returned to you that can be allocated to other efforts.
Take some time to do a thorough data roll call — break down silos, remove barriers and put information at your fingertips. In doing so, you’ll be prepared for the next step on the journey to a data-driven culture, which I refer to as “Applying the Data Glue.” Here, we will dive into how you can tie all of this data together into a cohesive, dynamic, real-time data-fueled machine of insight.
This is part one in a three-part series taking marketers on a journey to creating a data-driven culture. In this series, you’ll learn how to design a data-fueled marketing strategy that removes the gut check from decision making and enables hyper-relevant marketing at a global scale. Ready to keep going? Continue on to part two — “Applying the Data Glue: The Quest for a Data-Driven Culture.”


