What is Customer Journey Analytics?
Customer Journey Analytics is the process of analyzing the customer experience across every touchpoint in the customer journey. Often, machine learning, python, and various software tools like Adobe or Woopra are employed to fully measure customer interaction. There are many use cases and examples for applying customer journey analytics successfully.
By accessing this data, brands gain a bird’s-eye view of what the entire customer journey looks like.
They can follow the touchpoints leading up to a conversion to see what’s working, and more importantly, identify friction points that may be disrupting the customer journey.
In turn, they can see what’s contributing to customer success and loyalty, as well as customer churn.
That way there’s no guesswork as to how someone goes from being a prospect to a lead to a paying customer and beyond.
Instead, customer journey analytics allow companies to objectively and quantitatively measure the process from start to finish.
There are many use cases and examples for applying customer journey analytics successfully.
Why Do Companies Use Customer Journey Analytics?
There are five main reasons why companies use this software.
1. To Better Understand the Entire Customer Journey
Seldom does someone land on a website and buy right off the bat.
More often than not, it’s a complex process with multiple twists and turns along the way.
Looking at customer journey data allows you to “zoom out” and look at every single touchpoint to see the big picture.
If, for example, you wanted to see how well a paid advertising campaign was working, a customer analytics report would break it down step-by-step.
This is so you would know what percentage of leads clicked over from the landing page to the pricing page, then to the signup page before ultimately converting.
2. To Improve the Customer Experience
By gaining a holistic perspective, you’re better able to definitively determine strengths and weaknesses in the customer experience for direct insight on how to improve.
For instance, if there’s a particular bottleneck that’s resulting in a higher than average drop-off and inhibiting leads from converting into customers, you could pinpoint exactly where it’s happening.
From there, you can experiment with different CX initiatives until you find one that works.
It’s kind of like finding a leak in a pipeline where customer journey analytics helps you make data-driven decisions to better satisfy customer needs and consistently meet customer expectations.
3. To Increase Conversions
By understanding the end-to-end customer journey and enhancing the overall customer experience, increased conversions are usually a natural byproduct.
Let’s go back to our example involving a paid ad campaign.
If there’s a specific problem area such as a low number of leads making it from your pricing page to your signup page, you would know that your pricing page is the weak link and needs your attention.
But after fixing it, your number of signups should noticeably increase.
And it all starts with a customer journey analytics solution that provides a clear overview of customer behavior.
4. To Maximize Customer Retention and Loyalty
There are several factors that contribute to customer retention and long-term loyalty.
But one the most important is the first impression they have during the customer journey.
If you get started out on the right foot, providing a smooth journey with no major hiccups or bottlenecks, they’re not only more likely to buy, but they’re also more likely to stick around longer and become loyal customers.
This often means lower customer churn and a higher Net Promoter Score. Some may even become brand ambassadors.
5. To Boost Revenue
Finally, there’s a clear correlation between using customer journey analytics and driving bigger revenue.
To quantify, a Deloitte study found that customer-centric companies are 60% more profitable than those that aren’t.
And “86% of customers are willing to spend more on products for a great customer experience,” according to Super Office.
By understanding the nuances of customer behavior and putting the pieces of the customer journey process together, higher profits often follow.
This makes customer journey analytics the ultimate win-win.
How To Use Customer Journey Analytics
Step 1 - Define Goals and Objectives
First, decide exactly what it is you’re looking to accomplish with this form of web analytics.
With Woopra, for instance, some common goals users have is determining how blog engagement impacts free trial signups, how live chat affects conversions, and how effective ad retargeting is.
Goals and objectives can vary widely and will guide each subsequent step in the process, so you’ll want to spend time brainstorming with your sales and marketing team to ensure everyone is on the same page before moving forward.
That should always be an initial precursor to anything else.
Step 2 - Map the Customer Journey
Next, you’ll want to map out each specific touchpoint involved in the customer journey.
This starts with the very first touchpoint, such as arriving on your website, then engaging with your brand, then ultimately buying.
For example, if you wanted to see how live chat impacted conversions, the customer journey may look something like this.
In this example, it starts with someone being a first-time visitor, then starting a live chat conversation, then signing up for a free trial, and then finally upgrading to a paid plan.
Or, if you wanted to see how effective ad retargeting is, the customer journey may look something like this.
Here, this customer segment journey starts with a lead first arriving on a landing page. Then, they see a retargeted ad, move onto a free trial signup page, and finally upgrade to a paid version of the product.
Step 3 - Collect and Analyze the Data
At this point, it’s time to use a customer data platform to gather the data to generate actionable insights.
This typically comes in the form of journey maps or flowcharts that allow you to visualize the customer journey from start to finish.
Here you should be able to spot patterns and trends that provide an objective overview of customer behavior so you’ll know how everything fits together.
Note that the best customer data analytics platforms tend to be visual-centric and highly intuitive.
It’s also important to have a robust yet simple analysis workspace to help you make sense of a large volume of data and quick access to quality customer support and a professional contact center, especially when you’re learning the ropes.
Step 4 - Identify Areas for Improvement
From there, insights should emerge as to specific pain points or problem areas that are inhibiting the customer journey.
For example, a poor UX on your Google Adwords landing page may be preventing leads from moving onto the free trial signup page.
In this case, you would want to look for ways to improve the Adwords landing page UX to increase the percentage of leads that click onto your free trial signup page.
The beauty of Woopra, Google Analytics, and similar platforms is that it helps you diagnose the specific area of the customer journey with issues to ensure you devote your time to the right things.
At the same time, it also ensures you don’t waste your time trying to correct areas that don’t need fixing.
Note that in addition to identifying areas of improvement, you’ll also want to pay attention to the steps in the customer journey that are working so you’ll know what customers are responding to so you can double down on them.
Step 5 - Implement Changes
Now, it’s just a matter of taking the insights you’ve gained on customer behavior and making the appropriate changes to resolve the issues to create a better customer experience.
If there was an issue with an Adwords landing page that was stopping leads from moving to your free trial signup page, this could involve making your unique value proposition more pronounced or including social proof to encourage leads to take action.
Or, if there was a problem with your mobile app or social media page that was creating friction, you could narrow it down and make the appropriate changes.
Whatever the case may be, this is the stage where you work to improve the specific touchpoints that are creating problems in the customer journey.
Step 6 - Track Progress and Make Continual Iterations
Finally, it’s important to note that customer journey analytics shouldn’t be treated as a one-off type of deal.
Just like using Google Analytics or any other platform, it should be viewed as an inherently iterative process that’s evolving over time.
As your industry, product, and customer needs inevitably change, so should your sales and marketing approach to consistently provide the best customer experience possible.
Therefore, always be on the lookout for ways to leverage the customer journey analytics market to refine the process for optimal results.
Optimize for Conversion & ROAS Now! Explore Woopra in a demo and enjoy a 2-week free trial: https://www.woopra.com/demo
Customer Journey Analytics Examples
Now that we’ve covered the building blocks of a customer journey analytics platform, let’s go over the types of analysis it can perform:
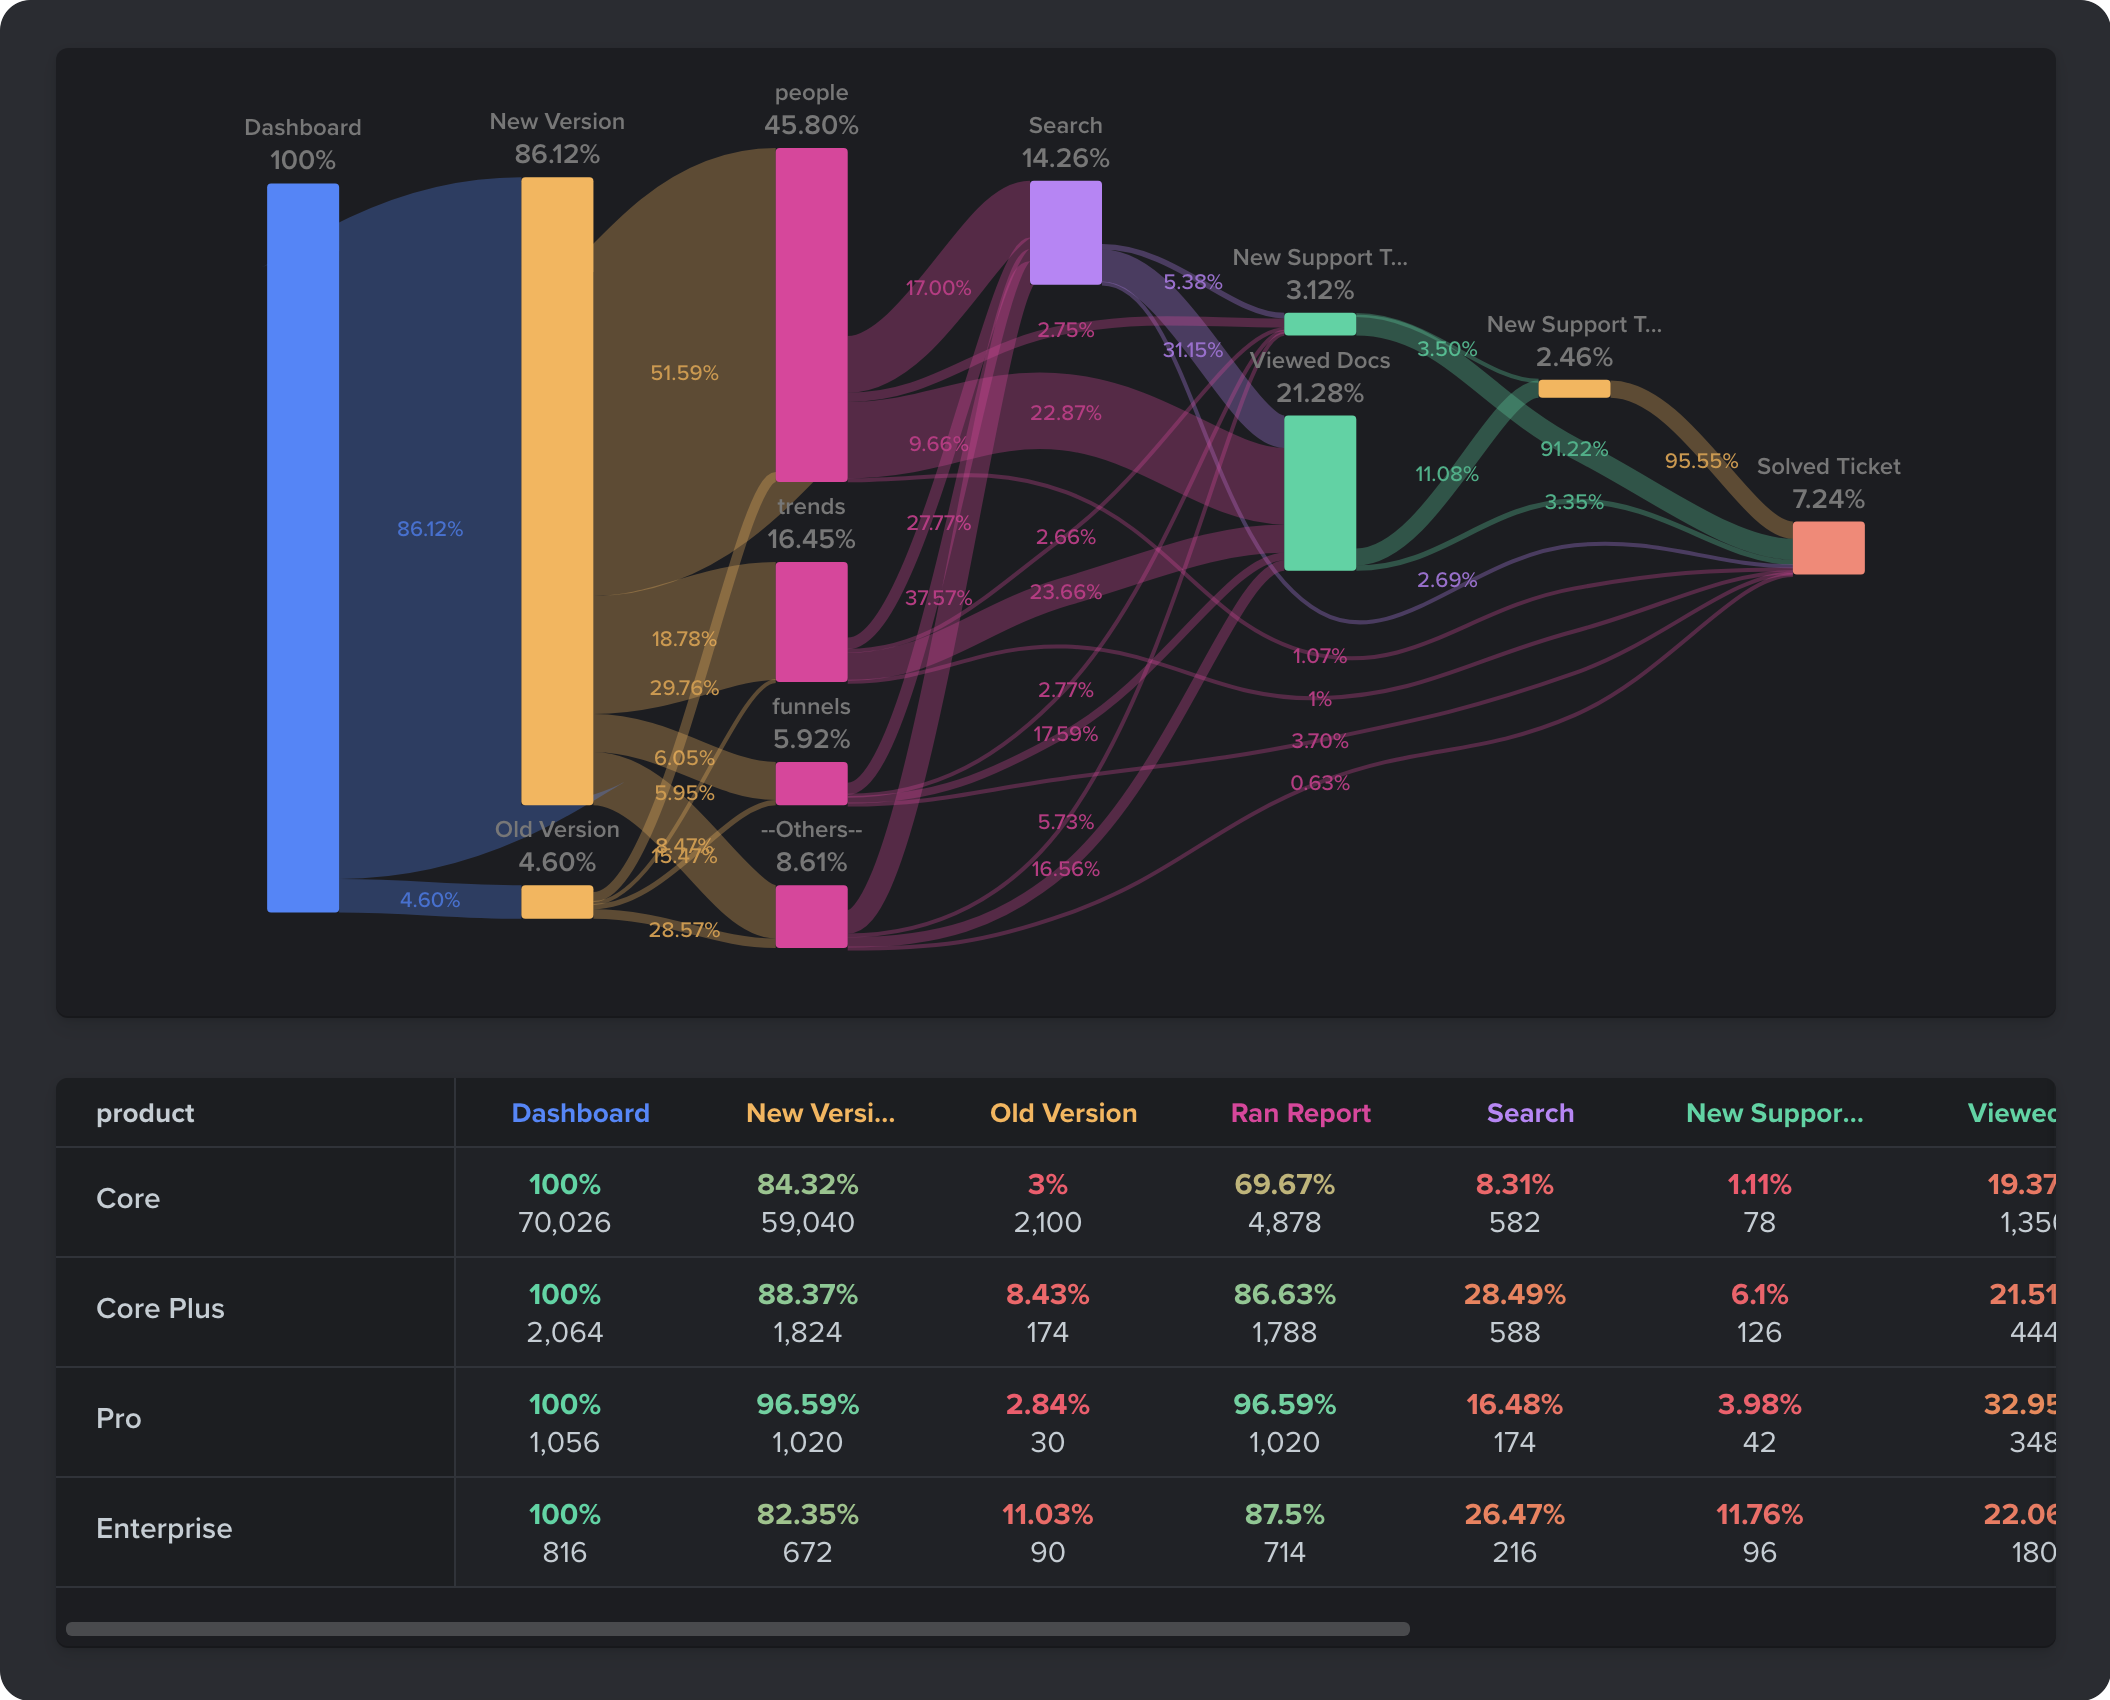
1. Journey Reports
The journey report allows companies to visualize customer touchpoints across multiple channels. With this report, companies can:
- Pinpoint potential areas of friction where users are dropping off
- Analyze the effect of initiatives on the conversion process in every step of the user journey
- Discover which paths users are taking before converting

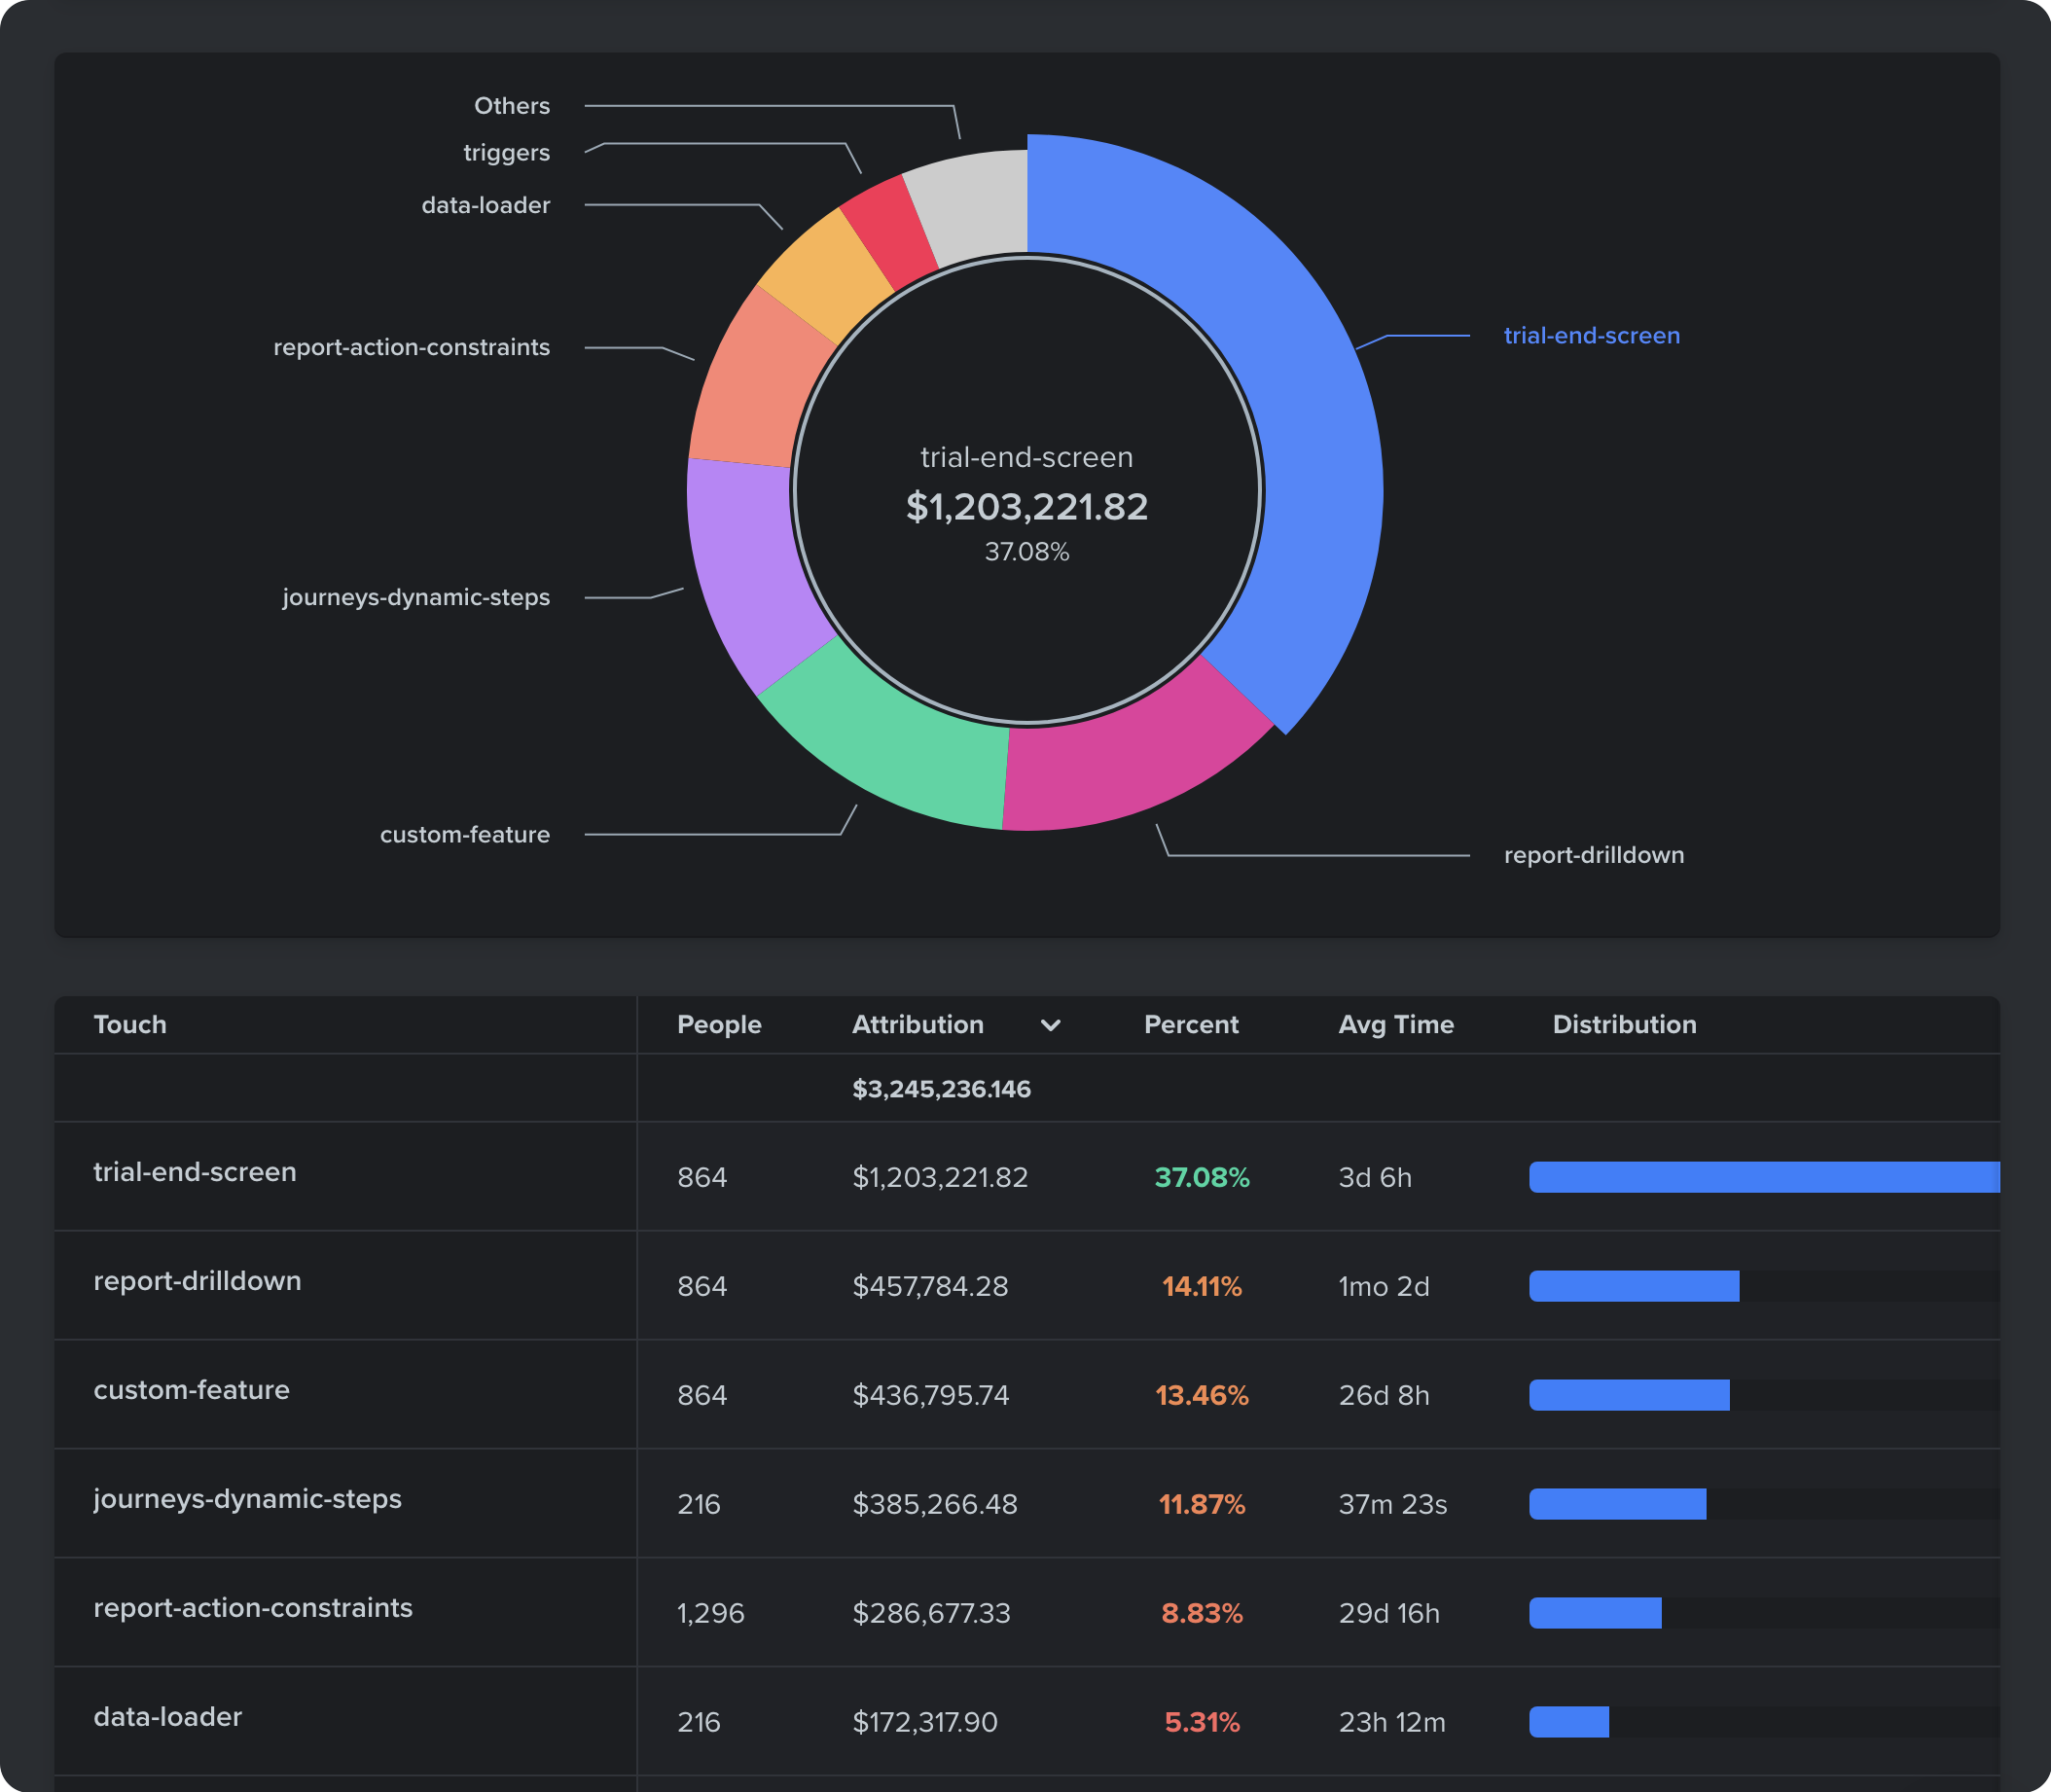
2. Attribution Reports
The attribution report allows companies to zoom in on successful customers and estimate specific touchpoints’ attribution to their success.
For example, product marketing teams can break down their revenues by the features that led users to upgrade. By attributing dollar amounts to different features, companies can fine tune their product roadmap to boost conversions and reduce churn.

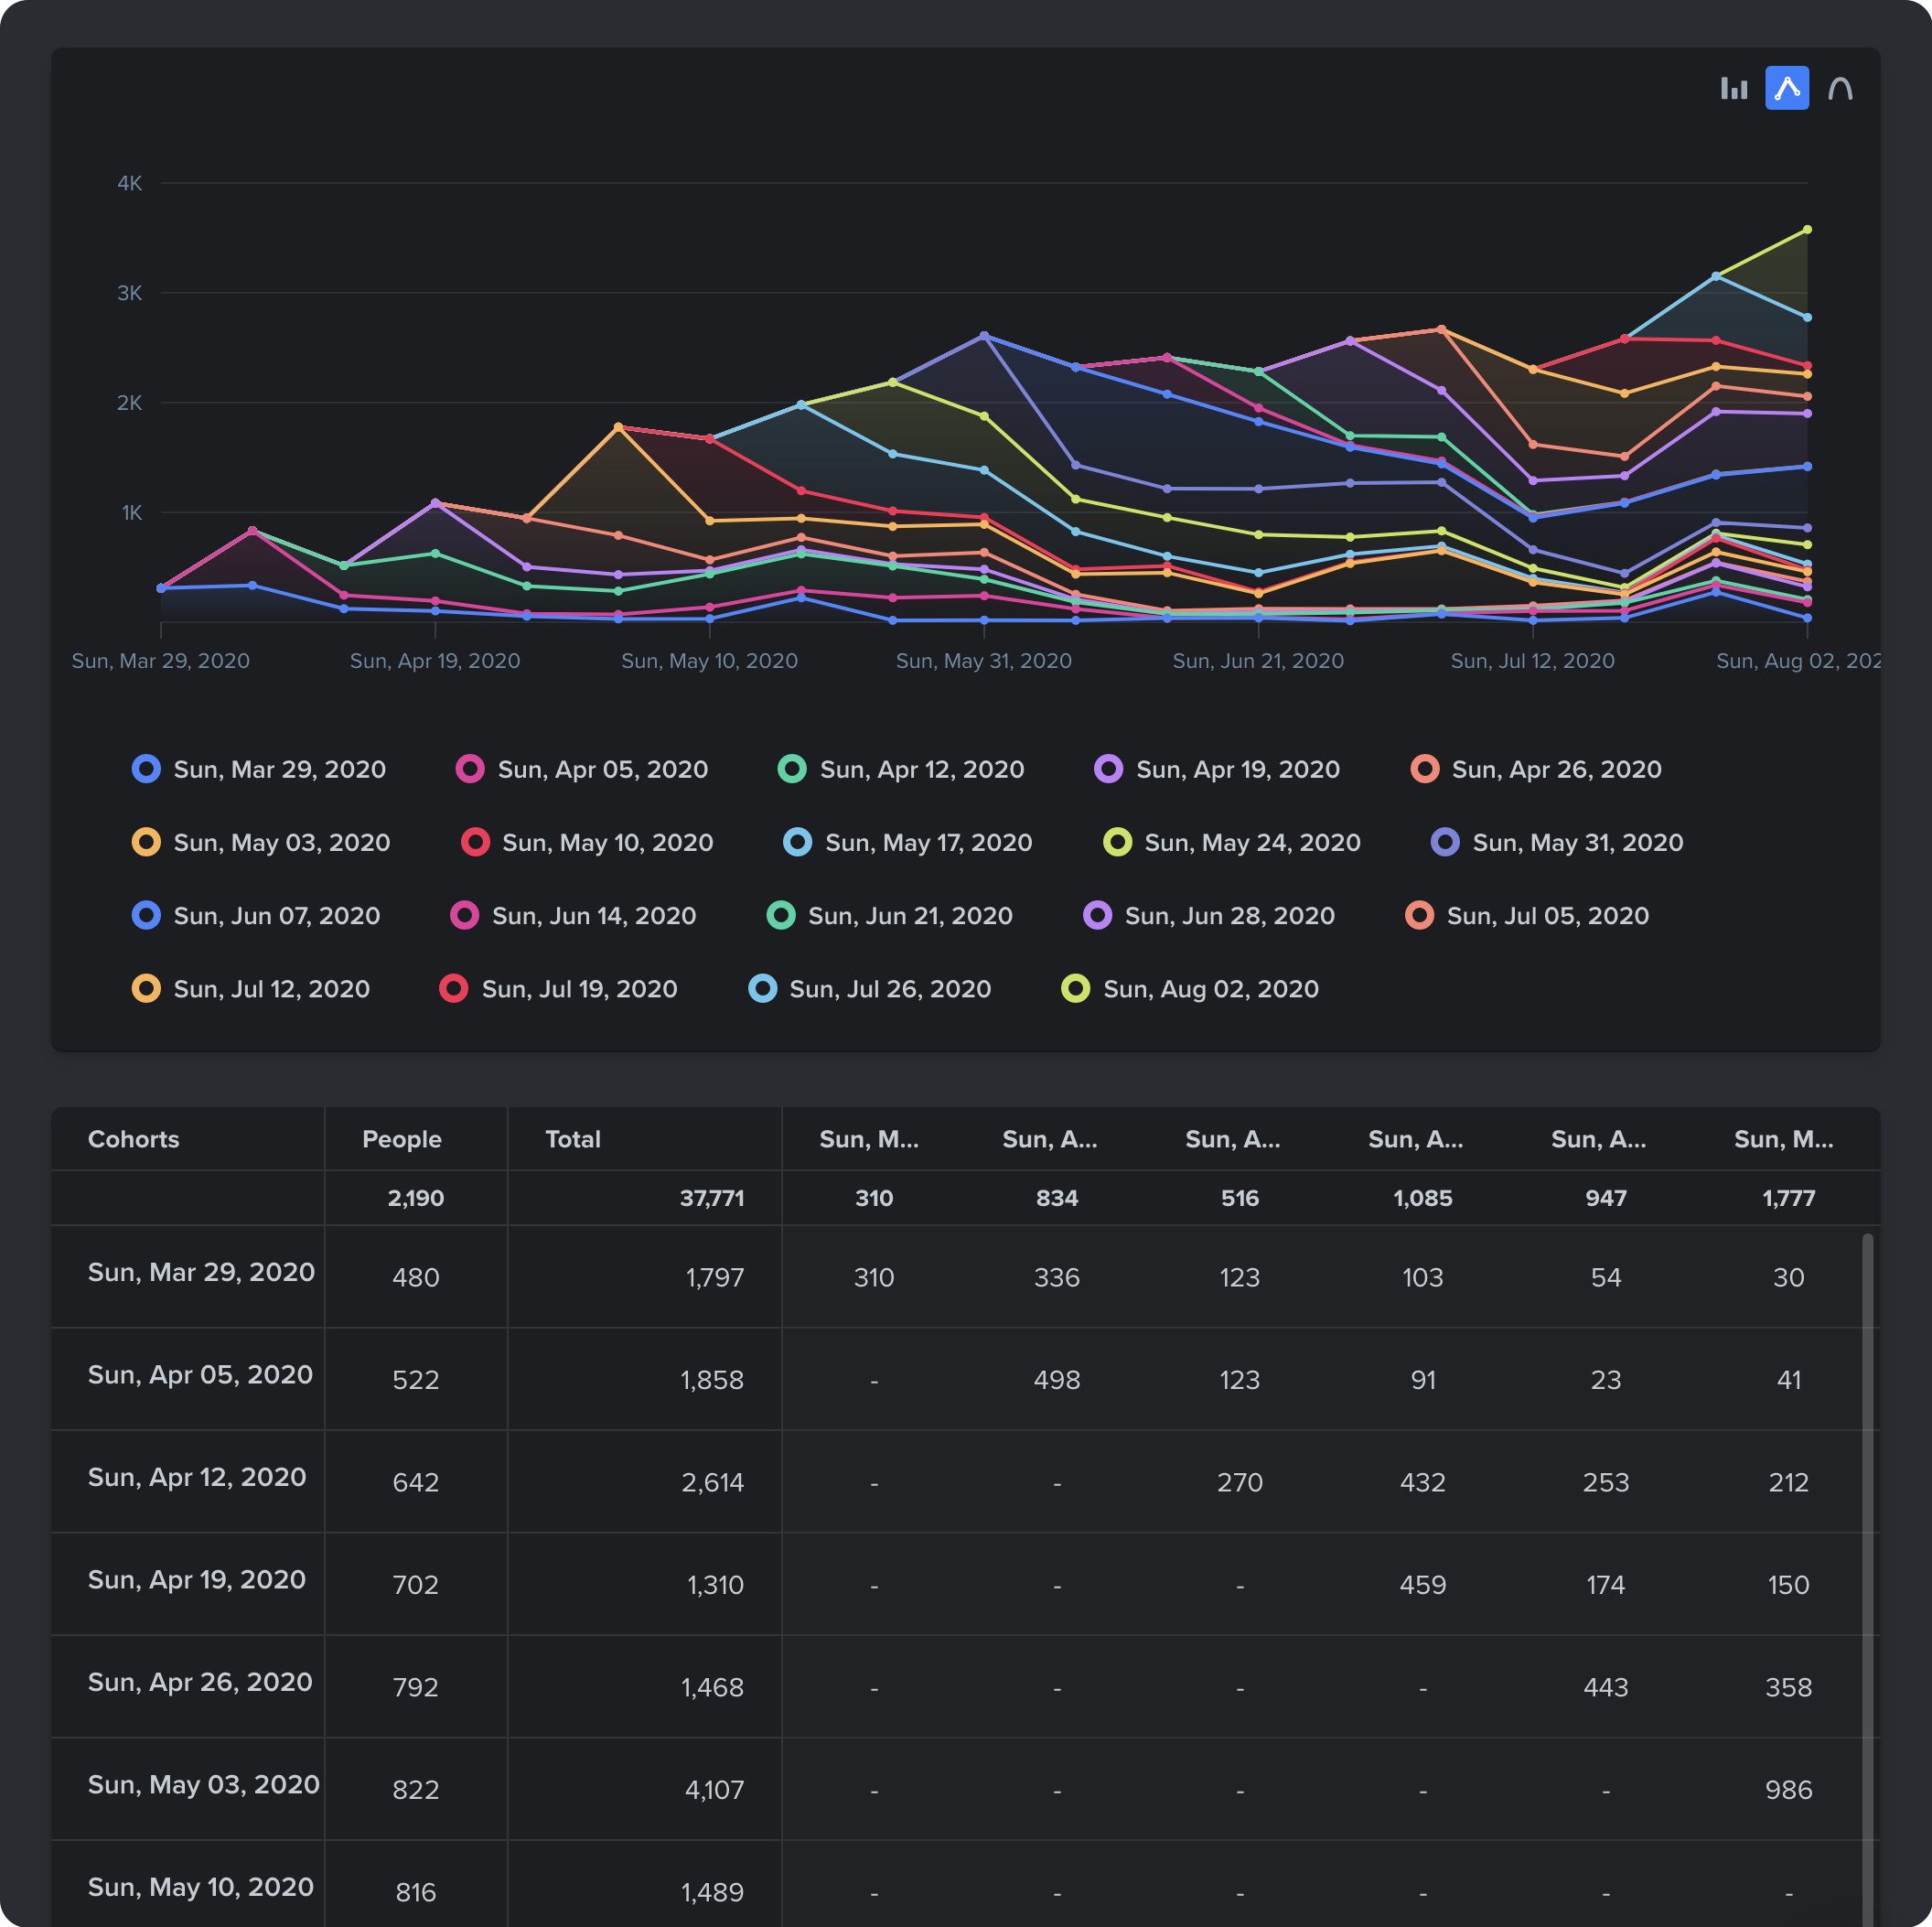
3. Cohort Reports
The cohort report allows companies to break down their growth by the periods a user performed a task. For example, a company can break down overall product usage growth by cohorts based on the time they signed up or used a feature for the first time.

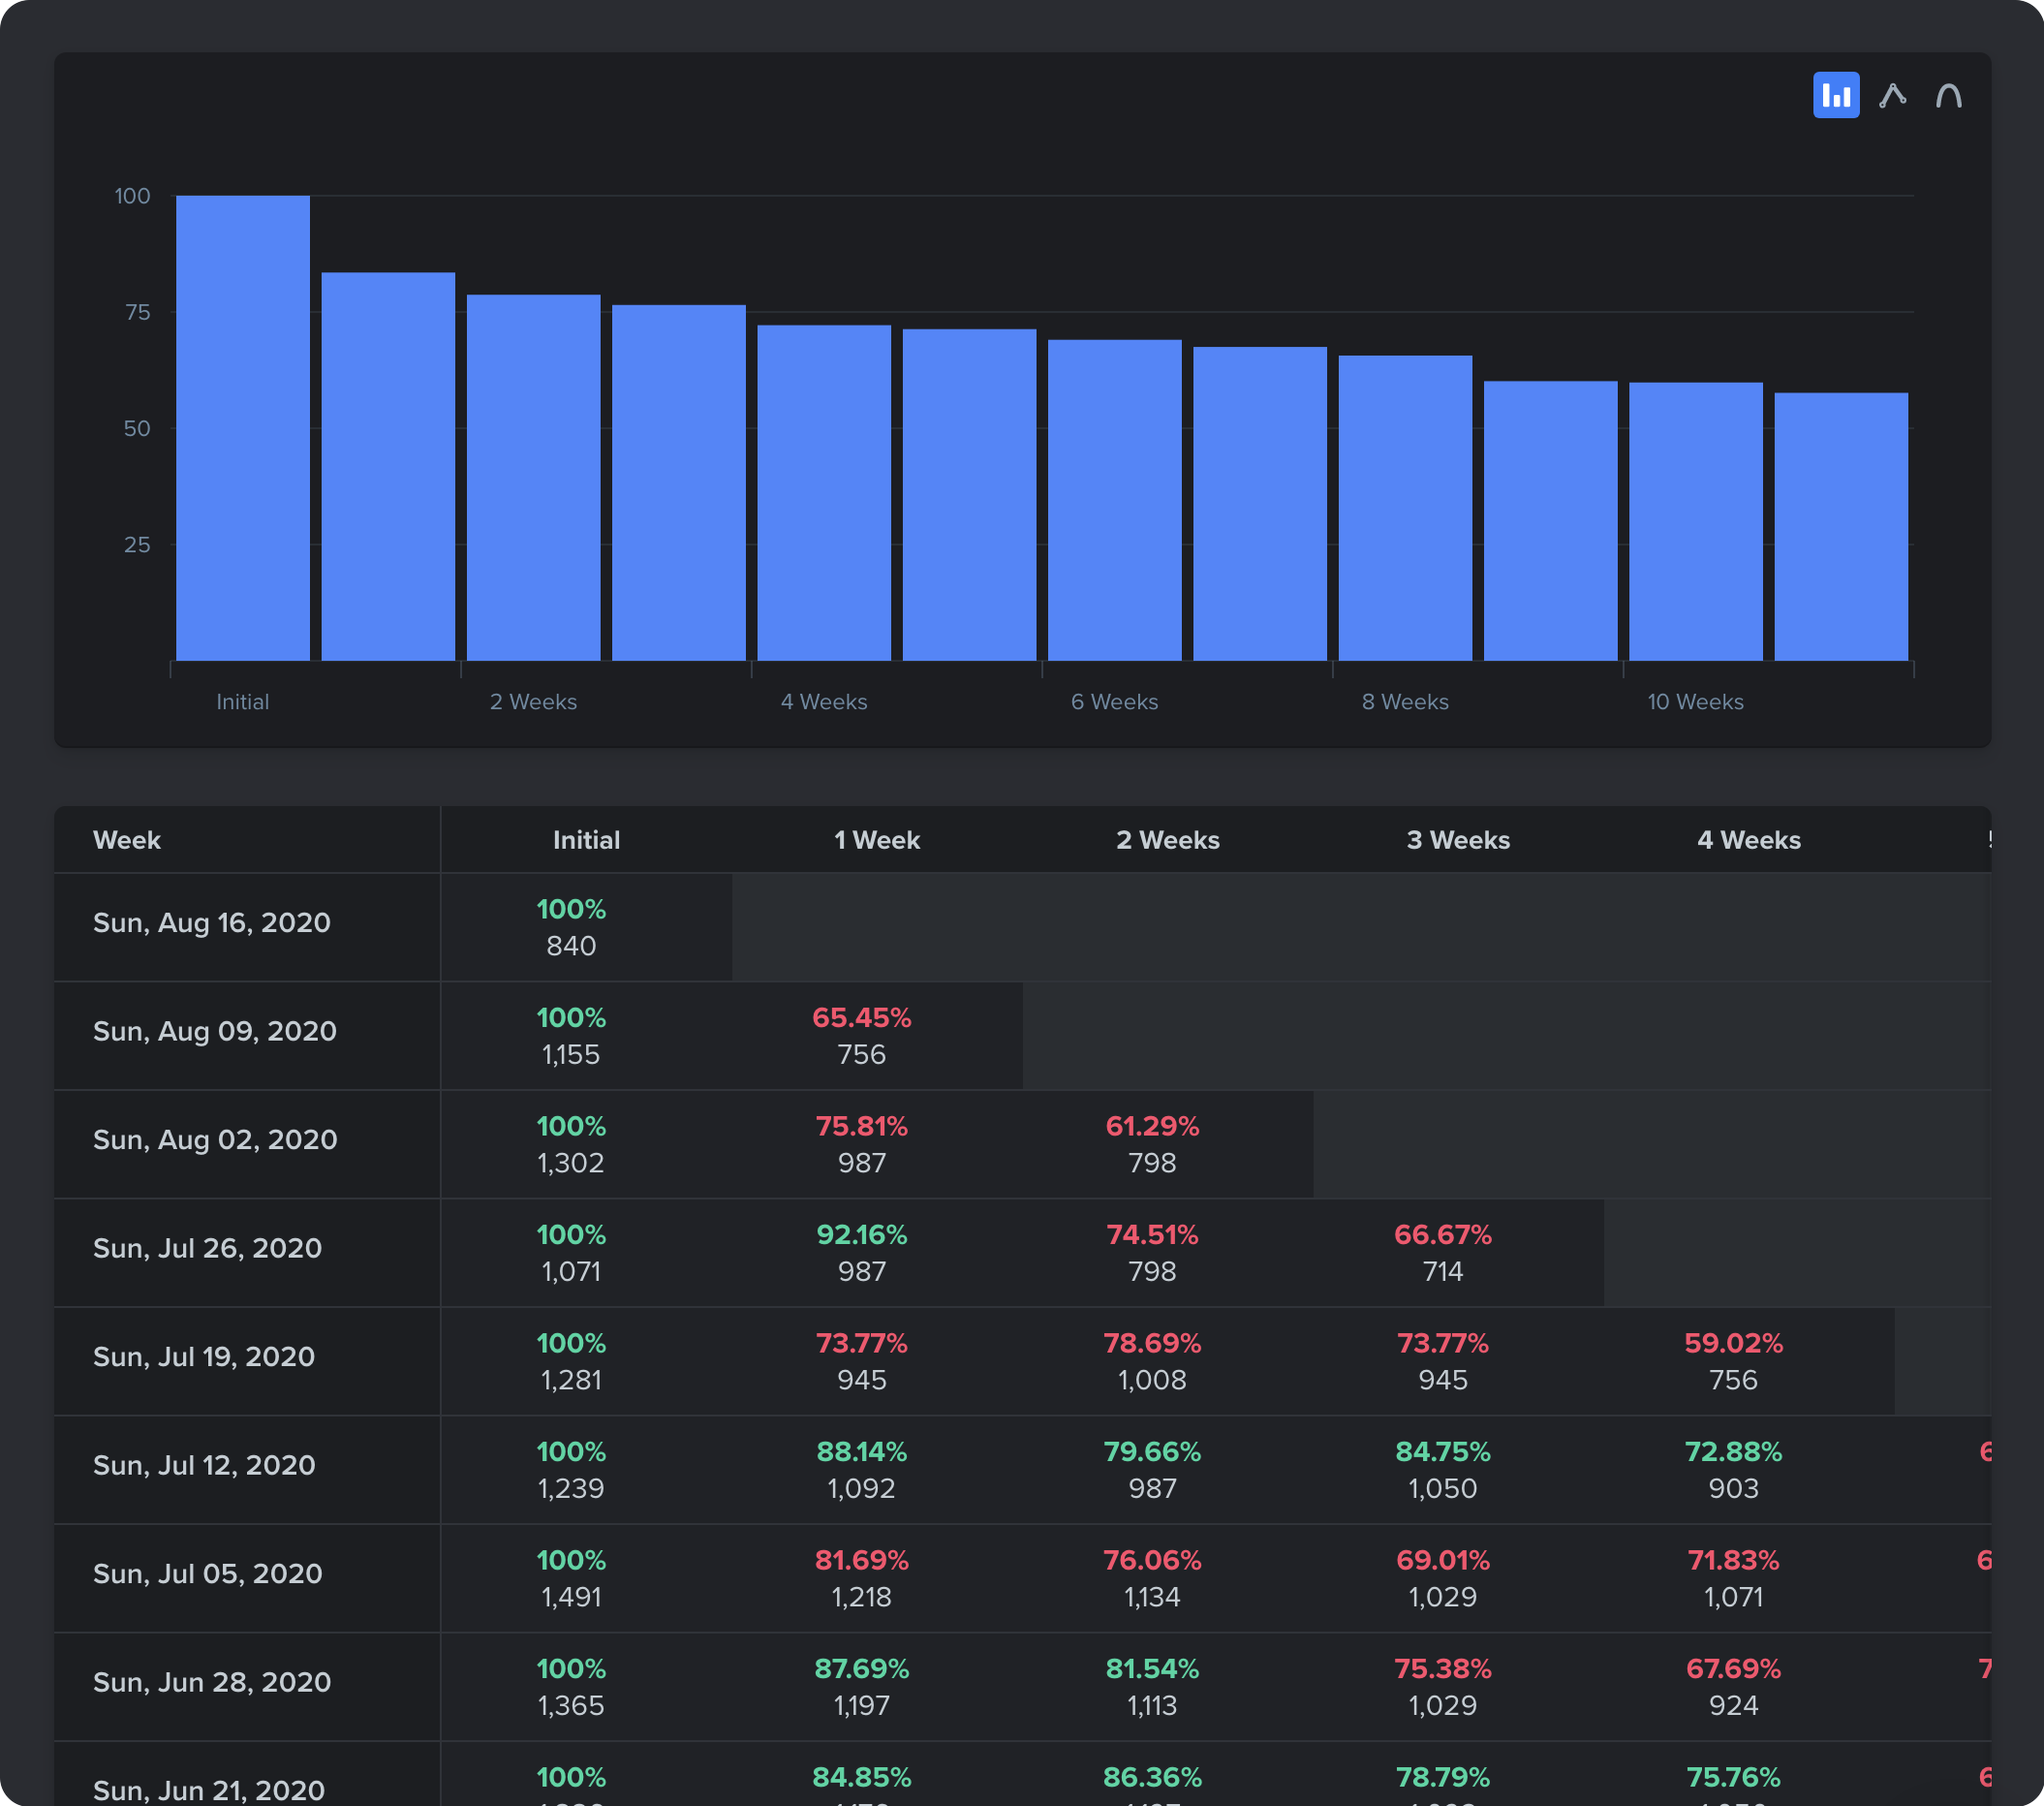
4. Retention Reports
The retention report allows companies to analyze how long users continue to engage with the business from the moment they perform a task. For example, companies can analyze the percentage of users who subscribe to an email or push notifications and then come back and use a specific feature.

Customer Journey Analytics vs. Customer Journey Mapping
While customer journey analytics helps companies measure and optimize the effectiveness of their customer experience, customer journey mapping is a related, but different, exercise where companies create a visual story of the customer experience. A customer journey map looks like a series of steps that the customer takes beginning with the first interaction with the brand.
Customer journey analytics both informs and validates customer journey mapping.
For example, customer journey analytics can tell marketing teams if a step in the customer journey is resulting in low conversions. This information can then be used to refine the steps laid out in customer journey mapping, such as adjusting the low performing step.
Similarly, customer journey analytics may confirm that a new initiative defined in the customer journey map is helping to retain customers as intended.
Join The Movement
Most companies today are failing to make customer data accessible to the vast majority of their team, meaning employees are often making decisions based on guesses. Customer journey analytics is one of the most impactful ways companies can democratize customer data. It allows every employee to answer questions critical to their work so that they can make better decisions.


