Properly tracking customer metrics is bound to help your organization’s health, wealth, and longevity. But do you know exactly which customer experience metrics are the most important? And what do you do with the metrics once you have them?
What Are Customer Metrics?
Customer metrics are what you track about your customers. These typically reflect numerical scores that summarize customer feedback — for example, the average satisfaction rating with product or service quality. Other customer metrics examples include customer satisfaction, customer effort score, loyalty rate, customer health score, and customer retention rate…
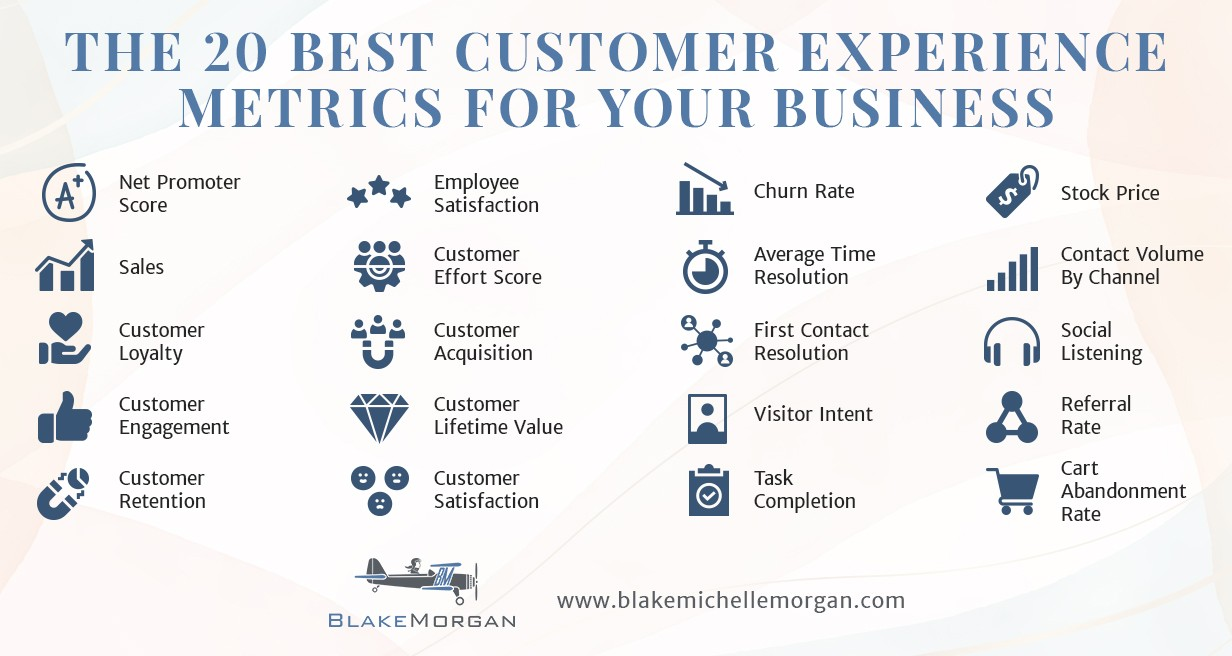
Here’s an extensive list of customer experience metric examples.
 Source: LinkedIn
Average Revenue Per Account (ARPA)
The Average Revenue Per Account (ARPA), or Monthly Recurring Revenue (MRR), is a measure of the revenue generated by each customer.
This metric helps classify high and low-revenue products and services, especially when it comes to segmenting different products for sale. These insights are extremely powerful to promote upsells and cross-sells, and can help show how valuable an organization’s services are to its customers.
For instance, if the ARPR grows within the existing customer base (and no new clients were signed), then your clients perceive value in your services and approve the expansion of those services.
Most B2B Software as a Service (SaaS) organizations and digital marketing agencies measure ARPR over several months to a year as these services are often subscription-based or held on retainer.
In contrast, e-commerce businesses should instead look to monthly recurring revenue to assess their company’s month-over-month revenue generation and implement funnels that will increase average ticket prices.
How ARPA is calculated
- Where Total Revenue = total income during the given time period
- Number of Customers = number of customers during the given time period
 Source: Wall Street Prep
Net Promoter Score (NPS)
NPS is a way to measure customer loyalty and, in turn, the likelihood of future purchases and referrals. A Net Promoter Score asks whether someone is likely to recommend your company.
This score is determined by a numeric survey that ranks the customer’s overall satisfaction with your organization on a scale of one to ten. Asking participants to explain their score will also provide clearer insight into your overall customer experience while revealing any abnormal or outlying sentiments.
Also Read: Effective Customer Journey Design
Remember when we spoke about customer relationship building? This is the key customer experience metric that will prove most useful in that analysis. NPS lends insight into multiple areas of customer behavior, including product quality, customer support, customer effort score, customer service metrics, customer retention rate, and more.
Ultimately, NPS serves as a proxy for potential growth based on customer satisfaction metrics and how likely you’ll receive referrals.
How NPS is calculated
NPS = % of Promoters - % of Detractors
Send a message to your customer base asking, “On a scale of 1 to 10 how likely are you to recommend this product or service?” And include a message field below to present your customer with an opportunity to justify their response.
Once you have compiled your feedback, take the percentage of promoters and subtract that by the percentage of detractors.
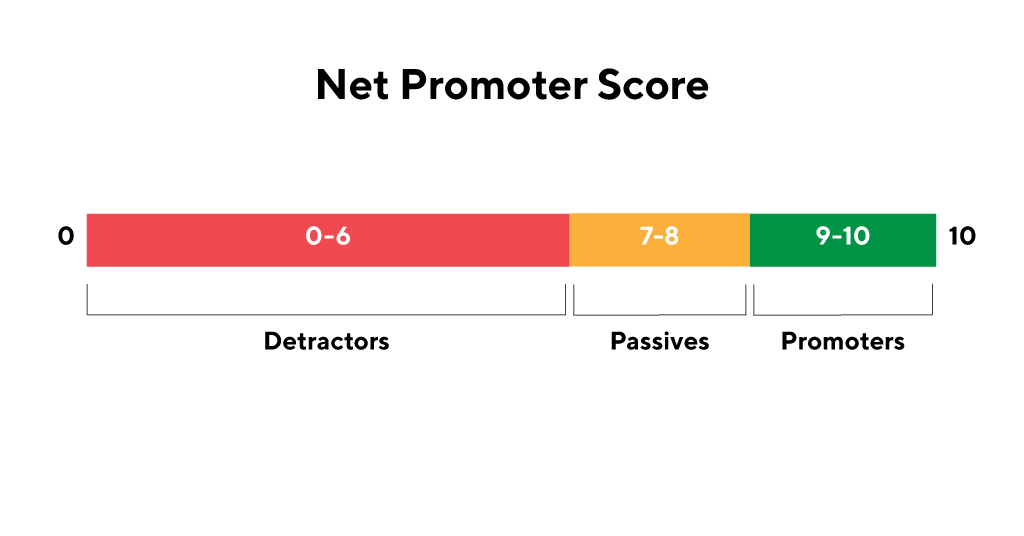
To accurately calculate your NPS score, you need to identify the number of promoters — those who cited high favorability via 9 or 10 ratings — as well as detractors — those who cited low satisfaction via scores 6 and below. Customers who marked 7 or 8 are considered passives.
 Source: ProductPlan
If the percentage of promoters is 62% and the percentage of detractors is 19%, you have a positive NPS score of +43. If we flip those numbers, for instance, if your percentage of promoters is 19% and your percentage of detractors is 62%, you will have a negative NPS score of -43.
Also Read: Customer Retention Metrics
A negative score can help to reveal glaring issues in your customer support team. For instance, a delay in answering support tickets or long hold times during phone calls could lead to a poor customer effort score.
If your customers add rationale to their score, you’re one step closer to identifying your strongest and weakest points of operation, which is extremely helpful for measuring customer experience. By implementing your findings, you’ll be in a much better position to improve the customer experience, your customer retention rate, and overall customer success.
Customer Satisfaction Score (CSAT)
In addition to measuring NPS, consider tracking your Customer Satisfaction Score. Though CSAT and NPS share common ground, they offer different snapshots of success.
CSAT is measured at specific intervals, for instance, immediately after purchase, during onboarding, during a customer service exchange, and so on. Analyzing the favorability of particular points of contact can help reduce Churn Rate and improve your NPS, CLV, and ARPA.
Like NPS, CSAT is measured by a customer service survey. This can also be a simplified scale with numeric options from one to ten.
How to Calculate CSAT Score
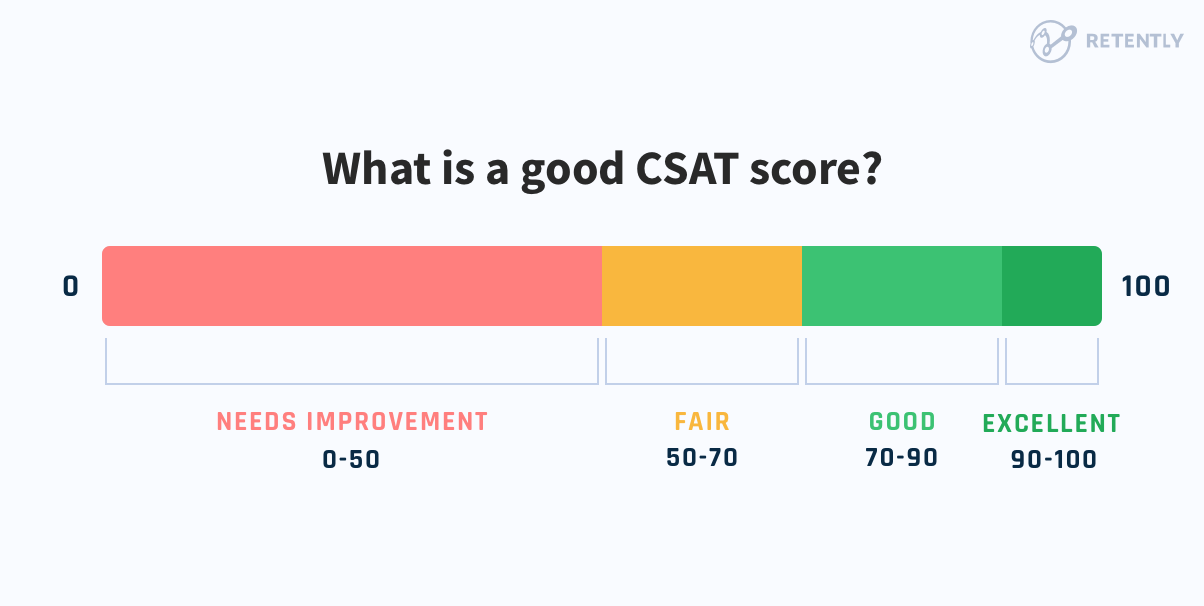
CSAT % = (#) of Positive Responses / (#) total responses X100
 Source: Retently
Customer Lifetime Value (CLV)
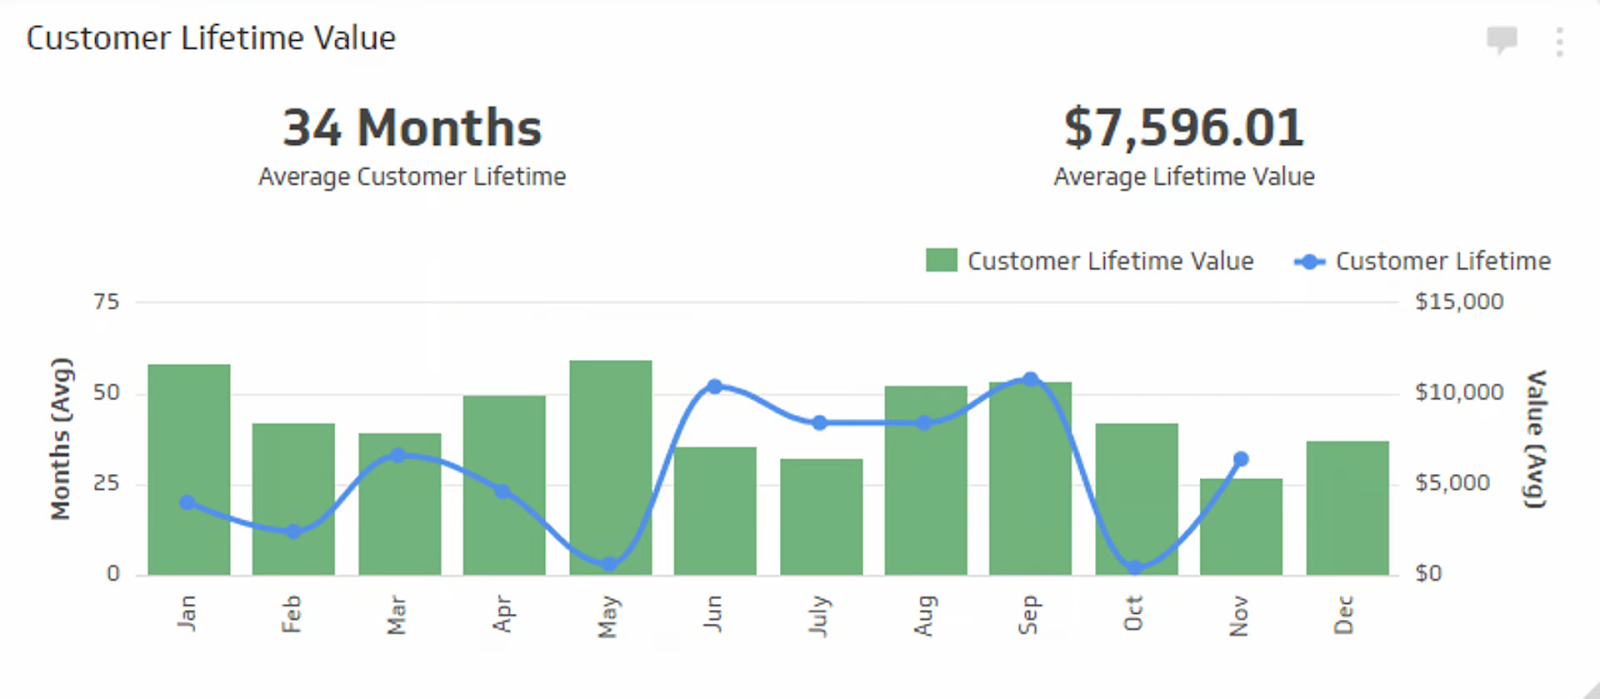
Customer Lifetime Value measures the total revenue a company can expect to make from a single customer over the course of their relationship. Here’s an example.
 Source: Klipfolio
This is one of the most fundamental customer success metrics and will help you determine the value of your customers over time, as well as the amount of spending needed to acquire new customers.
Moreover, measuring CLV will spotlight your most loyal customers and provide insight into increasing their value to you.
After all, it is much easier to increase the revenue generated by a loyal customer than it is from a new customer, so this is your chance to focus and deliver on their needs.
There are two ways to calculate CLV
- CLV = ARPA / Churn Rate (make sure that both ARPA and Churn Rate are calculated monthly)
- CLV = (ARPA * Gross Margin %) / Revenue Churn Rate (for differing ARPA across the customer base)
If this type of arithmetic isn’t your thing, you can also calculate CLV by multiplying average purchase value by average purchase frequency, taking that total, and multiplying by average customer lifespan (this is a solid formula for e-commerce stores).
If your CLV is increasing over time that is a clear indication that your clientele is finding success in your services and, therefore, more inclined to continue working with you.
If your CLV is declining, you can expect that your products are not offering value or a breakdown in your customer success team.
Properly set up customer journey analytics can automate the real-time calculation of your customer lifetime value.
Optimize for Conversion & ROAS Now! Explore Woopra in a demo and enjoy a 2-week free trial: https://www.woopra.com/demo
Customer Churn Rate
Customer Churn Rate reflects the number of customers a business is retaining.
There are a few telltale signs for churn rate:
- Cancellation of subscriptions
- Closure of an account
- Non-renewal of services
- Losing a client to a competitor
Each of these signs is different for every business. For instance, not all companies offer subscription-based ordering or services. So, before you calculate Customer Churn Rate, first identify how your churn is represented.
Also Read: Customer Journey Metrics
Bear in mind that most customers are more loyal than you may think. They won’t immediately pack up and shop elsewhere unless you’re really failing in customer service.
Moreover, if you're providing value to your customers beyond your products or services (which we'll get into below), you stand a much better chance at limiting Customer Churn Rate. With this in mind, Customer Churn Rate is a fantastic metric that will provide you a bird’s eye view of how well individual reps are performing.
How to Calculate Customer Churn Rate
Customer Churn Rate = # of Customers Terminating within a Timeframe / Number of Customers at the Start of the Timeframe.
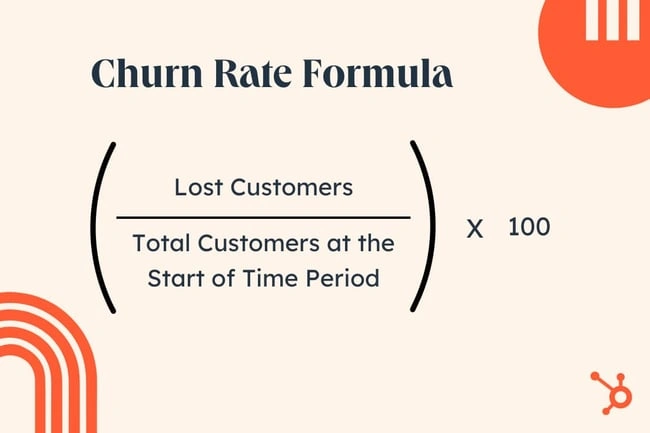 Source: HubSpot
When measuring your churn rate, be sure to exclude the number of new customers to join ranks that month. Your calculation should look something like this:
If you have 50 clients at the start of the month and seven clients did not renew their services or pulled out of contract, then your churn rate is 14% (7 / 50 = 0.14 * 100 = 14%)
Using Engagement to Reduce Customer Churn Rate
Yes, Churn Rate can be avoided by simply adding value to your customer experience. This can be done in a few ways. However, the most viable and sustainable method is publishing value-centric content that offers insights, answers questions, and improves your products' usability.
One great way to help clients build trust and cultivate loyalty is by answering questions their audience has yet to consider.
In doing so, they help solidify confidence in the knowledge of their products or services. When properly implemented, an authentic and proactive content strategy can drastically prevent churn rate and add to your CLV.
Customer Retention Cost (CRC)
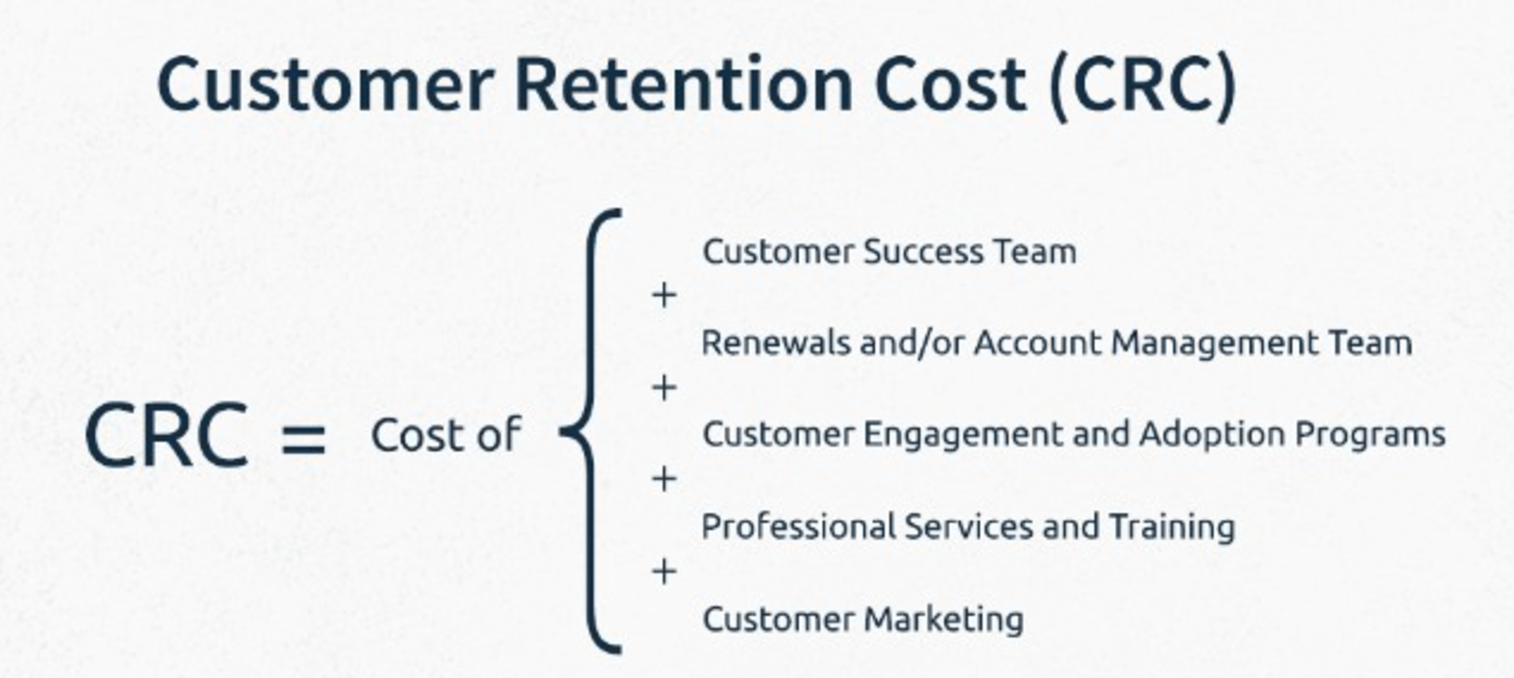
Customer Retention Cost is the amount of investment an organization makes to maintain and improve client relationships. This is the computed cost of all customer service and engagement for the sake of retention.
 Source: WiserBrand
Ultimately, CRC represents the ROI for efforts to monetize consumers and can help guide future business investments; for instance, if you should be investing in improving your customer success team or rolling out a new initiative or product.
CRC differs from Customer Acquisition Cost (CAC) in that businesses are investing in cultivating an existing relationship rather than investing in new leads.
Though both are essential aspects of business growth, CRC holds more inherent value as most organizations, especially B2B SaaS organizations, need to build lasting relationships to thrive.
Furthermore, in essence, CRC represents the quality of the consumer-brand relationship and can be a clear indicator of your perceived reputation.
For instance, if you find your CRC outweighs your ROI, you can expect a breakdown in your customer service team or a problem with your products that's costing you time, money, and glowing customer reviews/referrals.
Business operators need to consider many factors when measuring CRC, which may differ from business to business. Some factors that may impact CRC:
- Time spent on calls or in meetings
- Marketing costs
- Customer service/maintenance
- Pro bono hours of service
- Product returns
- Engagement
- Training
How to calculate CRC
There is not a commonly accepted formula for calculating CRC. However, in many instances, figures can be calculated by measuring purchases over a time period mitigated by retention cost, churn, and general overhead.
This is also a widely accepted formula:
CRC = Cost of {Customer Success Team + Renewals and/or Account Management Team + Customer Engagement Programs + Professional Service & Training + Customer Marketing}
While some companies utilize time tracking systems to measure time investment per project, comparing these metrics to the cumulative payroll for a customer service team to determine ROI is not a fit for all organizations. Detailed note-taking and spreadsheets can offer a free alternative.
But this process can be time-consuming, thus adding to CRC and eating into one’s profit margins.
At any rate, if you want to grow your business, you need to start tracking CRC, and CAC, so you know how and where to invest your money.
Many organizations determine their company's health differently, depending on the industry. But generally speaking - customer metrics are measured by the success of their customer service team, tracking how many demos a rep converts, how quickly customer inquiries have been resolved, how many email conversations reps are initiating, and so on. We’ll dive more into that later.
The best way to learn how well these systems are performing was (and still is) to ask your customers. Unfortunately, there is some drawback with that approach.
- First, not all customers will respond.
- Second, many responses may be biased because they're from the most satisfied or disgruntled customers
- Third, even if you get a response rate of 100%, it isn't easy to know how representative that sample is of your customer base as a whole
- Fourth, the criteria that organizations need to study to see the full picture is more detailed and can no longer be answered by studying customer satisfaction surveys or your customer success team's productivity.
In other words, the process is more detailed because customers are savvier in their list of wants and needs.
They want quality, responsive, timely support and need proof of ROI coupled with clear value indicators of what they are receiving and stand to receive by staying loyal.
And from this, the desire for genuine relationship building has emerged, which many businesses consider being the most vital operating goal today. This is what customer success metrics serve to cultivate and refine.
Before we explore the idea of using customer metrics to understand your customer base better and improve the way you operate to satisfy the customer need and grow your business relationships, let’s further define customer metrics.
Using Customer Success Metrics to Grow Your Business
Each business is unique, but we all share a similar mission: to improve our customers' lives by offering excellent products and services.
The best way to remain proactive in giving your customers _more_—more value, more reason to buy-in, more incentive for staying loyal, more cause to refer—is to gauge your customer success metrics.
If you’ve never considered these calculations or you have considered them, but didn’t know how to gather the information you needed, trust that it’s never too late to get started. If wondering how to track your customer metrics, both customer analytics and product analytics are great solutions.
Use this guide as an outline to start recording your successes and failures. And be sure to analyze all six customer service metrics. Otherwise, you may never truly balance your operations to scale your business.


