At the end of the day, the number one goal of your product is to provide the best possible user experience.
There’s a lot that goes into that, but quantitatively analyzing the user experience across your product is one of the best ways to gain insights.
That’s where product management analytics come in.
What is Product Management Analytics?
Simply put, product management analytics involves gathering data to understand how users interact and engage with your product.
By analyzing that data, you can then identify opportunities to better manage your product and make more informed decisions.
Say, for example, there’s a particular feature that users find difficult and is creating problems. With data analysis through product analytics, you can uncover precisely what the issue is so you know what to fix.
Conversely, if there’s a feature that users are enjoying, a product analyst can identify that as well and know what is working to guide future product development.
The overarching purpose of product management analytics is to gain insights into the user experience and then use that data to make the necessary changes.
Rather than speculating on how users are engaging with your product, this type of data analytics lets you know for certain so you can base your decisions on objective information.
In turn, this equips a product analytics manager with the insights needed to create better products and features.
Why Product Management Analytics Matter
Most experts will agree that making data-driven decisions in nearly every facet of business is important. According to PwC, “Highly data-driven organizations are 3x more likely to report significant improvement in decision-making.”
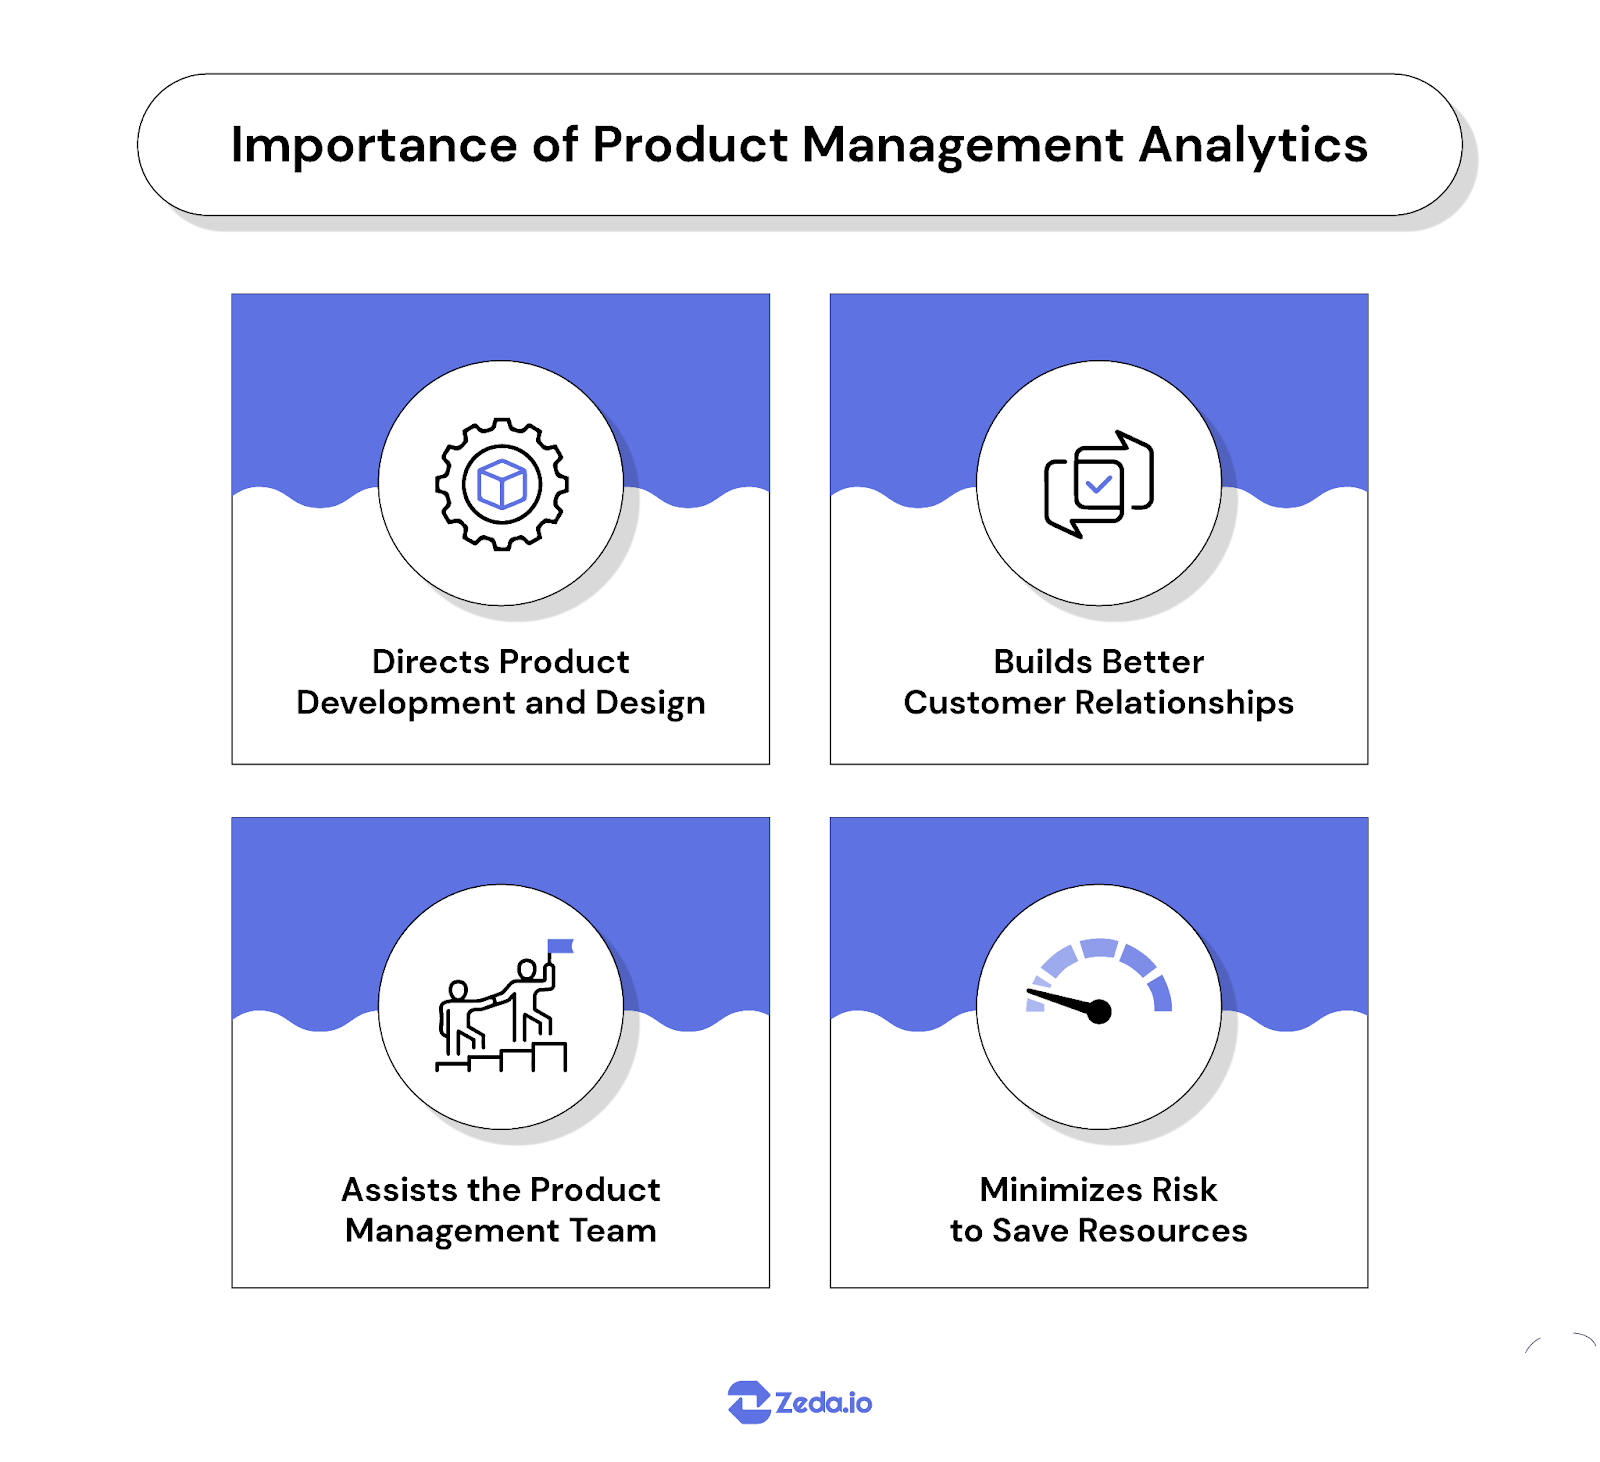
There are four main reasons why it’s critical for product management.
Source: Zeda.io
First, it provides a product manager with concrete user behavior data so they can identify patterns and trends to guide their decision-making.
Going back to our example about a difficult feature, a product manager could use the data generated from product analytics to initiate a redesign of the feature, as well as guide future development and design decisions to enhance product usage.
Second, optimizing a product improves the customer experience, which often increases loyalty and brand advocacy. Needless to say, this is crucial to the long-term success of a product and something product managers should take seriously.
Third, it aids the product management team as a whole because, again, they’re able to base their decisions on objective information rather than merely a hunch.
If an AI product manager was overseeing the development of a new AI product feature, for instance, they could use the product analytics data to streamline the process.
Finally, you can reduce risk and save resources because all of your decisions revolve around real customer behavior and what they have done versus hypotheticals. This is important for businesses of all sizes, but it’s especially vital for smaller businesses with limited resources.
Common Product Management Analytics Metrics
Onboarding Completion Rate
Shows a product manager what percentage of users complete the onboarding process.
This metric is highly important because it sets the stage for overall customer success, as “63% of customers think onboarding is key to deciding to subscribe to a product, and 74% will switch to other solutions if the onboarding process is complicated.”
User Engagement
User engagement is a broad metric that can encompass multiple types of data analysis including monitoring:
- Daily active users
- Monthly active users
- Session duration
- Bounce rate
Product Performance
This can include page load time, which shows how long it takes on average for a particular product page or feature to load.
It can also include error rate, which indicates how frequently product users report issues, as well as the severity of the issues.
Feature Adoption
There are two key feature adoption metrics.
One is feature usage, which monitors which features are actively being used by customers.
The other is the feature adoption rate, which measures the percentage of users that have adopted a particular feature.
Conversion Rate
A product manager may measure a data point like what percentage of users complete a desired action, such as free users signing up for a paid product version.
Monetization
This can include things like in-app purchases or how much revenue is generated over a certain period of time.

Retention
The percentage of users that continue to use your product over a specific period.
This can include using your product as a whole. Or it can be more granular and look at how many users return after using a core digital product feature.

What Types of Data Should a Product Manager Look At?
In terms of data types, it can be broken down into five main categories.
- Trends Analysis: Product managers look at overarching trends over a period of time. An example could be seeing if customers used a particular feature more or less over a six-month period.
- User Journey Analysis: This involves a data product manager analyzing the end-to-end touchpoints in the customer journey to identify bottlenecks and potential areas for improvement.
- Attribution Analysis: With this data type, product managers can discover which touchpoints are contributing to success. In turn, they can gain a better understanding of product owner preferences for product features.
- Cohort Analysis: Here, a product manager can break down user behavior by freemium signup data, product purchase date, and more to compare growth during the course of the customer lifecycle to see what’s leading to success.
- Retention Analysis: Again, this lets a data product manager know what the churn rate is and how many customers continue to use a product.
How to Use Product Analytics to Improve the Product
This process involves five key steps.
First, choose the core metrics for data analysis that are essential for reaching your product management goals.
As we just discussed, a data analyst can leverage numerous product metrics, but you’ll want to zero in on those that directly contribute the most to attaining your product vision.
Second, analyze user behavior for those metrics, looking for patterns and trends, as well as aberrations that lend insight into the user experience.
Third, hypothesize which specific factors are contributing to patterns, trends, and aberrations. For example, maybe you believe that poor onboarding is leading to excessive churn and reducing customer loyalty.
Fourth, implement the necessary changes to improve the product. In the case of a poor onboarding experience, you may use surveys to pinpoint exactly what’s causing friction during onboarding and address it.
Fifth, measure the impact of the changes to ensure you’re getting the results you want and continue to make iterations until your analytics product manager is satisfied with the customer experience.
Note that like marketing analytics, product management analytics should be treated as an ongoing process where continual refinements are made to keep it optimal for users. This brings us to our next point.
Product Analytics vs Marketing Analytics
The key difference between product vs marketing analytics is what aspect of user behavior is measured with a data product.
Product analytics focuses on understanding how a user interacts with a product, what they do when using your product, and how frequently they do it.
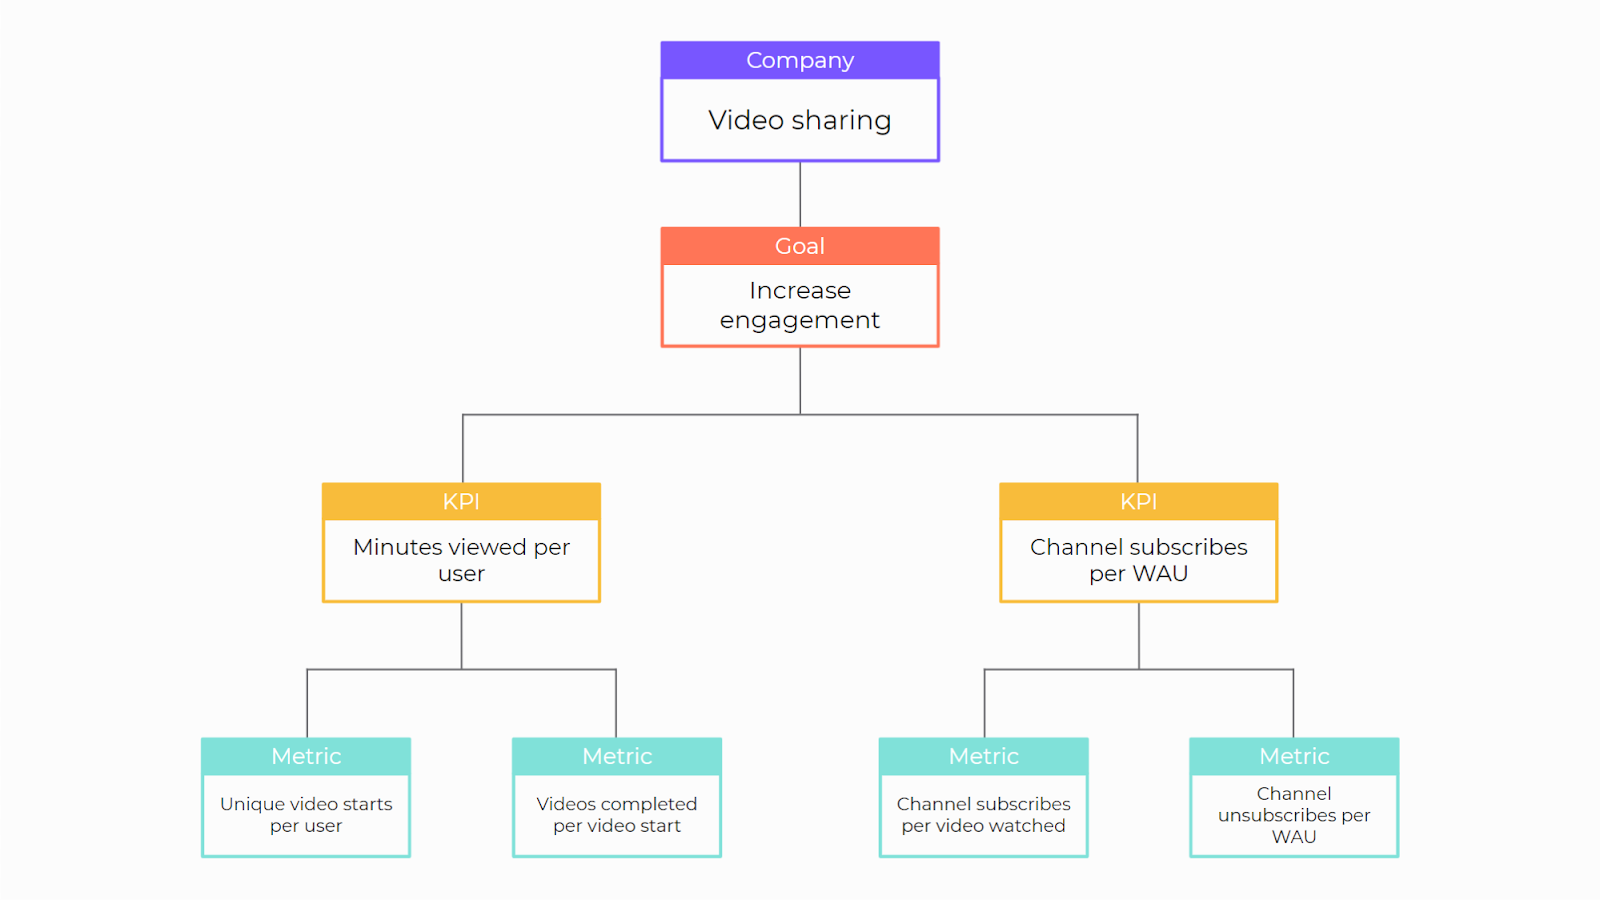
For instance, a company that sells video-sharing software may analyze how many minutes are viewed per user and how many channel subscriptions there are per weekly active user.
Source: Mixpanel
Marketing analytics, on the other hand, centers on assessing the performance of your marketing campaign and the strategies you use.
For example, you may use marketing analytics to identify which marketing channels are driving the most product signups.

Or you may use it to see how effective your retargeting campaign is so you’ll know whether or not the results justify your investment.

Both involve the use of data science to optimize your business, but each type of analytics specializes in a different area.
If you’re interested in educating your data product manager further on data analytics, we recommend these five product analytics books.
Product Management Analytics Examples
To gain a deeper understanding of the practical purposes of product management analytics and how product managers may leverage them, let’s look at some specific ways it can be used.
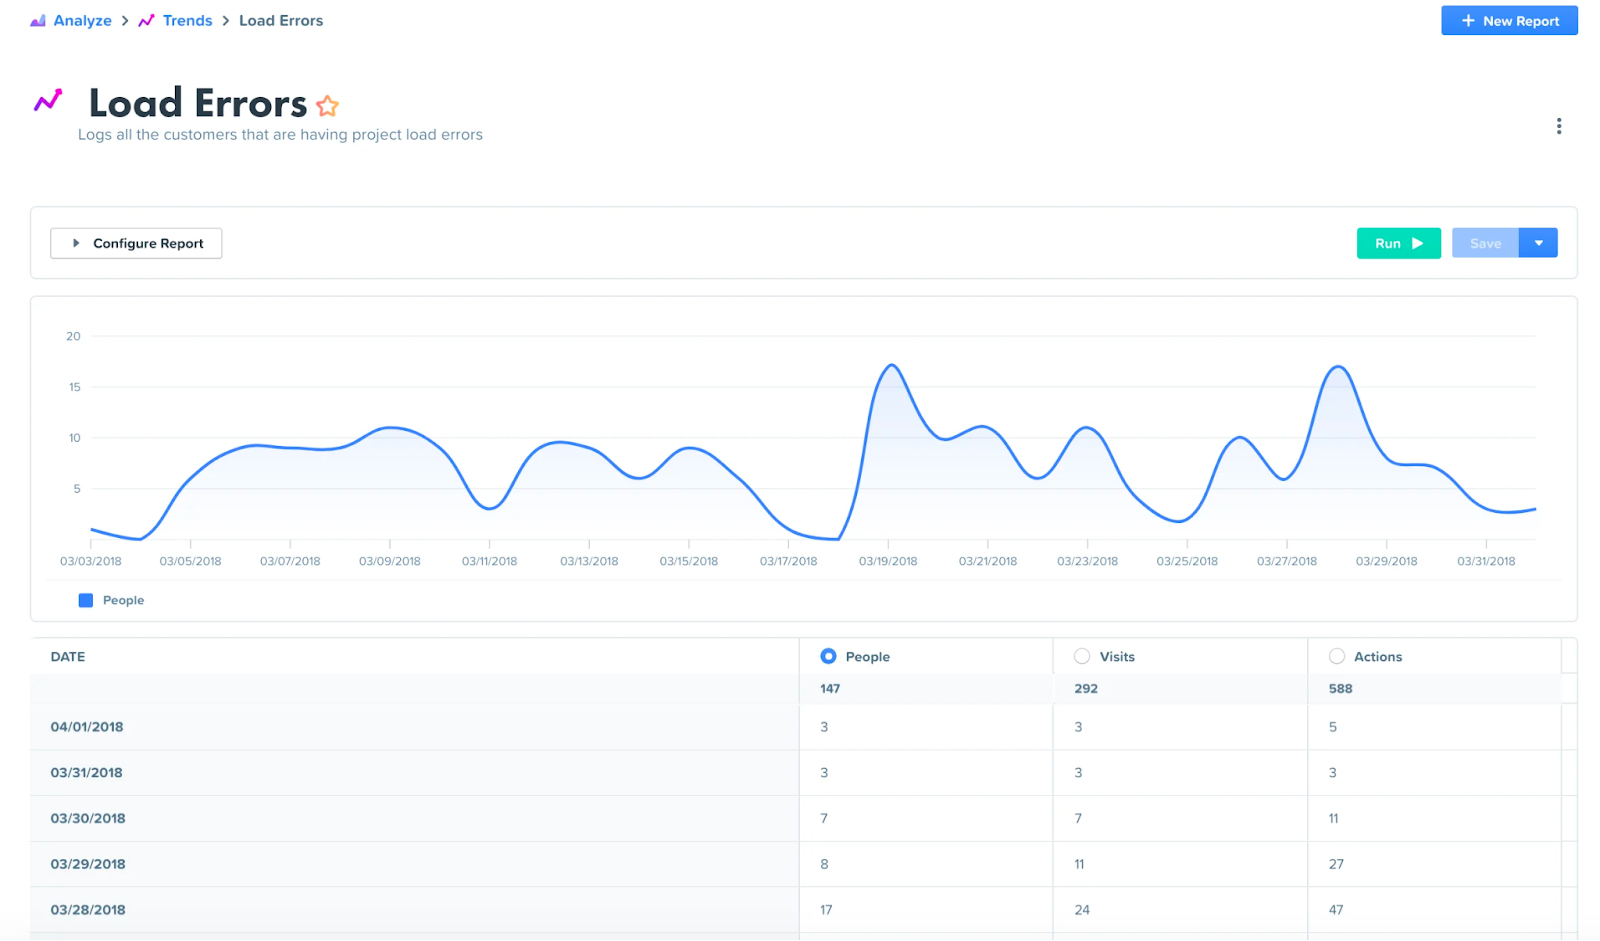
One is to monitor load errors to identify when and where issues occur that can be detrimental to the user experience.
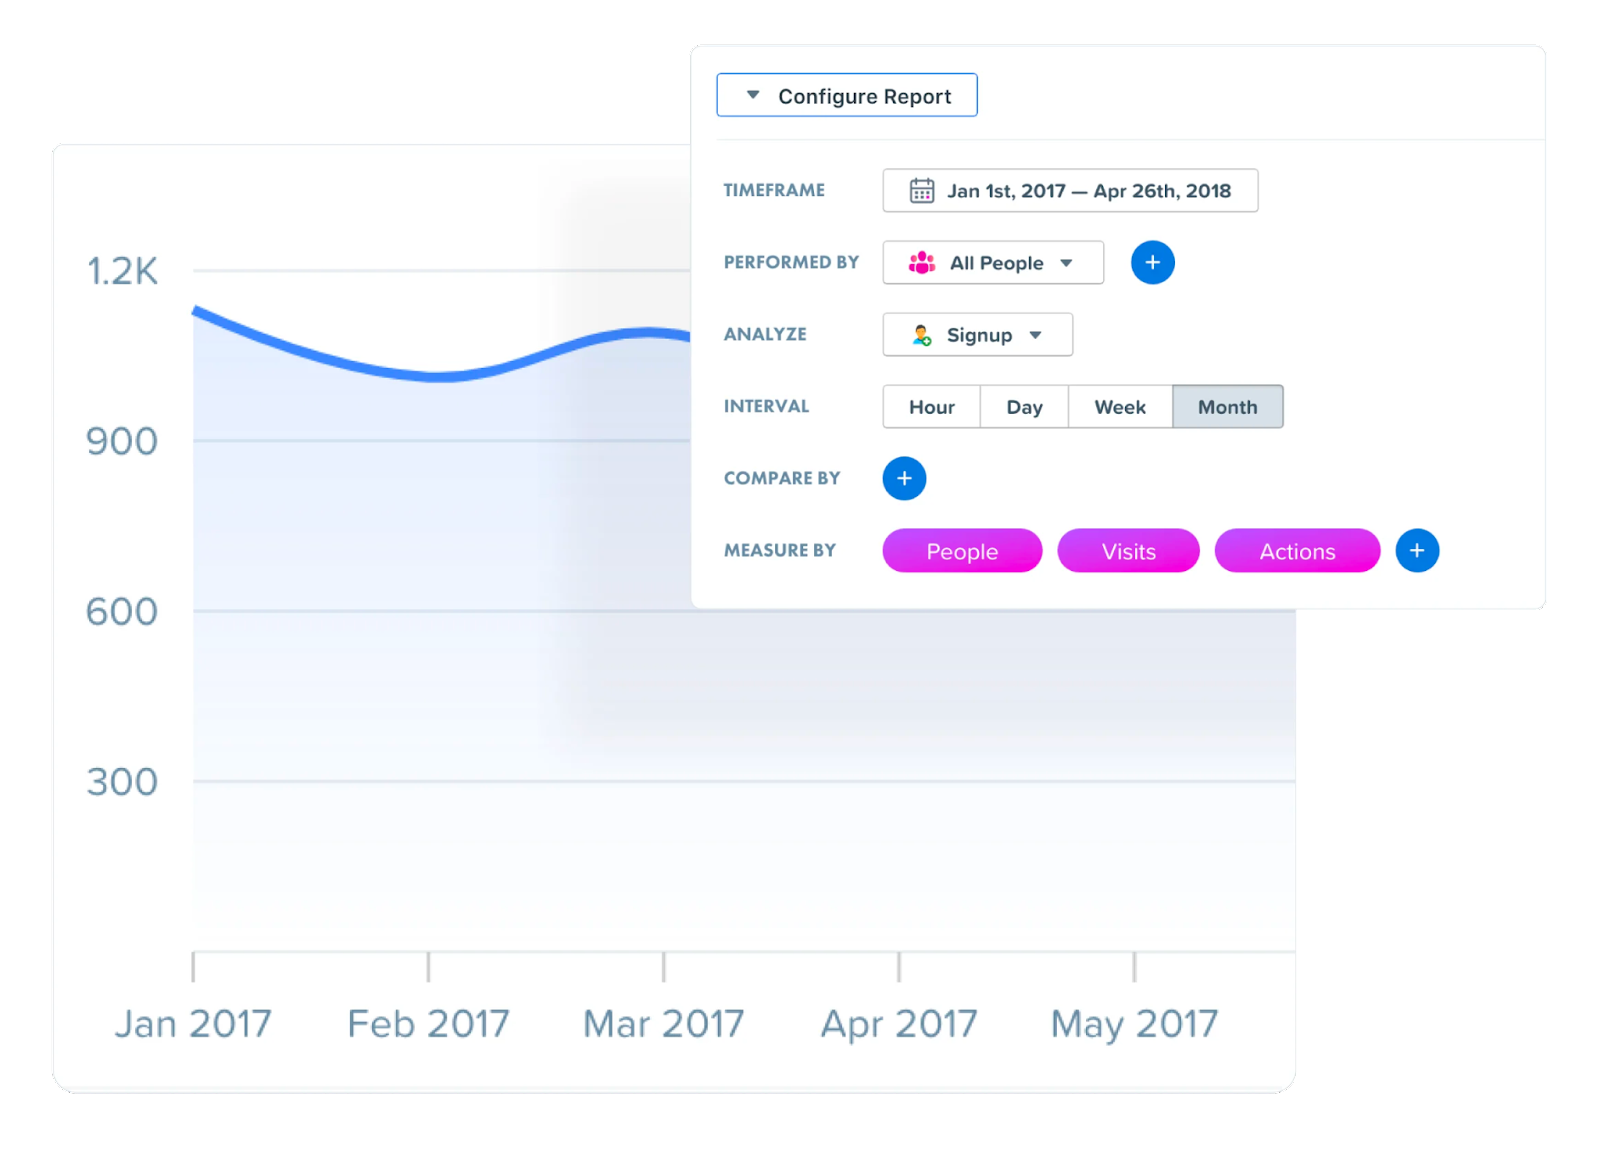
For instance, part of Woopra’s trend reports is letting product managers monitor bugs in real time so they can see when they happen and how they affect product performance.
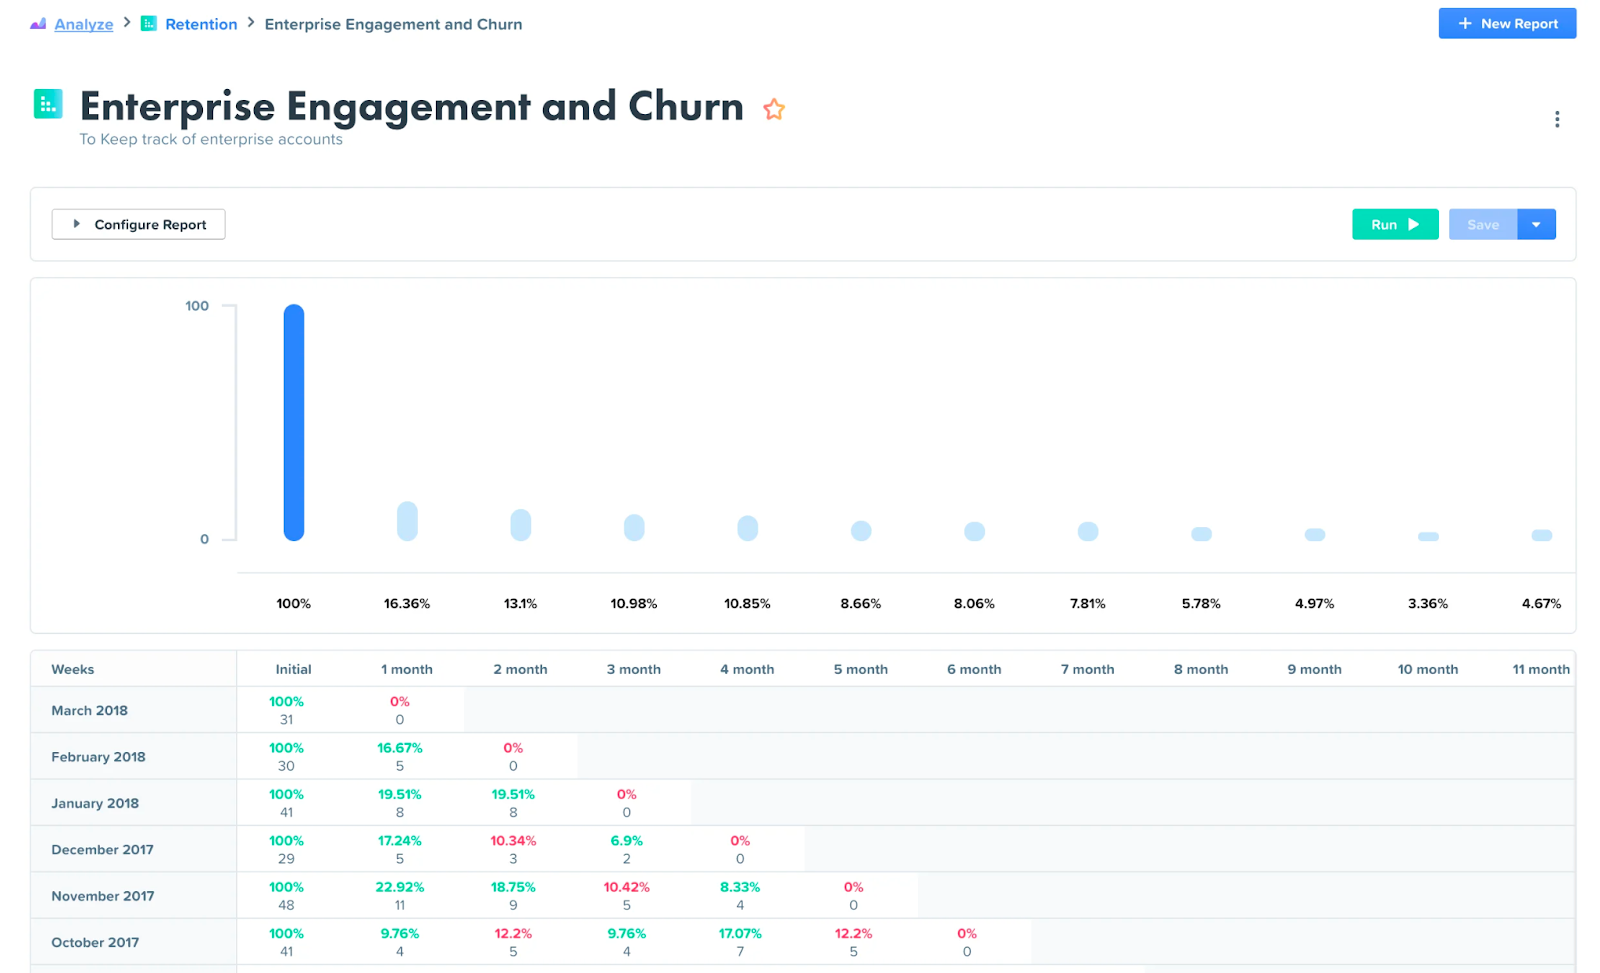
Another example is measuring your churn rate to 1) see how many customers you lose over time and 2) what specific factors contribute to churn.
Going long-term, a senior product manager can use trends reports to zoom out and measure product performance over time.
Say you wanted to see the impact releasing a new feature had on product performance and whether it was leading to a higher number of signups. You could analyze the data during a timeframe after the release to objectively see.
How Woopra Helps Product Managers Track the Product
A product analytics tool like Woopra helps product managers at all stages of user engagement.
From the moment a new user signs up…

…to when they first use a core product feature…

…to when they officially become a customer and beyond, Woopra supplies end-to-end data analytics to enable product managers to see a holistic picture of user behavior.

Woopra offers all of the different data types mentioned earlier, such as trends analysis, user journey analysis, and attribution analysis so that product managers can track user behavior every step of the way and conveniently share the information with their product team.
While other data product tools like Google Analytics and Adobe Analytics tell some of the story, Woopra is specifically designed to be an end-to-end product analytics tool for robust business intelligence.
No matter what stage of product adoption your product manager needs insight on, Woopra can provide it.
Closing Thoughts
At the end of the day, product manager analytics provide valuable insight for data-driven decision-making.
With it, product managers can understand the nuances of how users engage with a product.
In turn, they can optimize it and continually improve their product strategy, while having the same level of insight as a data scientist, even though it’s not part of their job description.


