Web Analytics is a term that describes the process of collecting, measuring, and reporting on user interactions on a website. Web analytics is mainly used by marketing, SEO, UX designers and conversion rate optimization teams.
This is the first article in a four-part series on web analytics. The links to the other articles are at the bottom of the page.
Web analytics data points are usually collected by placing a tracking snippet on a website.
This snippet of code allows a Web Analytics platform to track a website visitor behavior, including pages they view (commonly referred to as page views), button clicks, form submissions and more.
By collecting this data, Web Analytics tools can infer insights such as the number of users who visited a website in any given time period, engagement rate, time spent on pages, conversion rates.
These tools can also be used to identify bottlenecks in the conversion process by highlighting where visitors typically bounce or drop-off during that conversion journey.
The most well-known web analytics platform is Google Analytics, but other platforms such as Woopra can provide more specific insights for companies looking for advanced web analytics or product analytics intelligence.
Why is Web Analytics Important?
Tracking and analyzing visitor data helps web properties improve revenue, customer experience, and retention rates.
When data points are collected, measured, and then analyzed, areas of opportunity for improvement can be discovered, thus kicking off the optimization process.
For example, if a SaaS company is looking to increase the conversion rate for signups, an analytics tool such as Woopa makes it easy for non-technical team members to review the funnel data to see where the problem is.
Perhaps there is a low “Time on Site” for new users which may indicate that the product is not explained well in the website copy.
Alternatively, maybe users are signing up for a free trial, but then not converting into paying customers. In journey analysis, you might find the problem lies with getting people who signed up to log in the first time. In this case, a better onboarding process can be recommended.
Also Read: Use Customer Loyalty Analytics to Improve Targeting
Or perhaps getting users to log in for the first time is not an issue. Maybe the issue is once inside the platform, new users aren’t playing around with key features, in which case a welcome tour might be suggested to point users in the right direction.
Without having the right web analytics tool and strategy in place, a company won’t know how to optimize performance. Whether it’s the marketing, sales, or support team, each would benefit from journey analysis in a tool such as Woopra.
The Most Important Web Analytics Metrics
While there will be custom data points for certain business types, most companies can benefit from tracking the most popular web analytics metrics listed below.
Visitor Data
Visitor Data refers to information collected about the people engaging with your website or web app. Core data points collected about an audience include these:
- Individual User Information - name, email, company, etc.
- Account Information - prospect, leads, paying customer, plan types, etc.
- Demographics - gender, income, career, education level, etc.
- Location- country, region, state, city
- Custom Usage Metrics - total payments made, items purchased, downloads/uploads, most used features, etc.
In Woopra, collecting data about these metrics will help you put together an Ideal Individual User Profile. With this data, you can make informed decisions when it comes to your marketing efforts and advertising campaigns.
This is particularly important when it comes to spending money on advertising because you’ll want to scale up in the areas that you know work best for you.
For example, if your Ideal User segment is males between the ages of 35 and 55, who live in a major city and have a career as a software engineer, you’ll want to place your ads in front of people who meet that same criterion.
During the sales cycle or trial period, with custom usage metrics, you could also see which aspect of your product a particular segment of customers is using the most—further enhancing your marketing focus.
Visitor Behavior
Visitor Behavior refers to the actions a particular user or cohort of users displays during the customer journey. These are some of the core metrics to review:
- Feature Usage - interactions with your product or service.
- Visit Length- the duration of time a visitor or cohort of visitors spend engaging with your web property before leaving.
- Pages Views- the number of times each separate page on your site (or within your app) is viewed.
- Referrer Data- information on how your visitors came to your site such as direct traffic, search, ppc, marketing campaigns, etc.
Understanding Audience Behavior metrics is important because getting the right people to your web property and keeping them there long enough to have a good user experience is important for the overall health of your business.
Conversion Rate & Event Tracking
The Event Tracking and Conversion Rate metrics go hand-in-hand because you will likely track the conversion rate of the people completing key events on your web property.
- Event Tracking - Measures how many people complete a specific on-page action such as clicking certain links, completing purchases, downloading key items, submitting forms, playing videos, and other user events that you want to track.
- Conversion Rate - Calculates the percentage of people who complete a specific, important event such as submitting a form, starting a free trial, making a purchase, etc.
The events you track should relate to your specific conversion events and key product features. While it’s certainly possible to track every event on your site, it’s often more beneficial to reduce the noise and focus on specific actions that meet your analytic goals.
For example, if you’re focusing on site registrations, tracking every single click on your site could be excessive. Instead, you could simply track how many people click the “Sign Up for Free Trial” link. From there you would likely calculate the conversion rate of how many people who click the link go on to sign up for the free trial.
Similarly, you might track how high value customers are interacting with your products in relation to low value customers. In this case, tracking the use of key product features would be more important than tracking blog posts.
When in doubt on what to track, you could see if your analytics tool of choice can help in this area. For example, Woopra's onboarding support can provide an in-depth outline of what exactly to track to reach your analytic goals.
Individual Customer Journey Tracking
Often, web analytics marketers will look at aggregate data or all of the website visitors/users to see how groups of people or segments are behaving on the web property.
This is important because you likely have hundreds or thousands of people visiting your web property each day, and you want to make sure it’s optimized for your users.
However, data on individual users can be extremely useful. This is helpful when trying to close a deal, upsell a contract, or make sure that new customers are having a smooth onboarding experience.
Most web analytics platforms are unable to provide individual-level analysis such as Google Analytics. However, Woopra is designed to give both aggregate and individual data. You can see more on how they compare here.
Using Woopra, you can see who is:
- Making payments
- Interacting with your website
- Opening emails
- and using key product features
If your sales team is looking for data on real people, individual customer journey analytics tracking through Woopra is the solution you need.
Funnel Analysis
One way to know which key events are important is to map data to the different stages of your marketing funnel.
Here are some things you can track for each phase:
Awareness Phase
- Number of visitors
- Product interest
- Percentage of unique visitors
- Visit length and scroll depth
- The source visitors come from
- Clicks to social media channels
Consideration Phase
- Conversion rate for email opt-ins
- Conversion rate for downloads
- Number of visitors who click key links (e.g. Start Free Trial)
- Number of visitors who watch key videos (e.g. product demo videos)
- Number of visitors to key pages (e.g. pricing page)
- Engagement with key content
Conversion Phase
- Number of visitors who sign up, register, and complete a goal
- What people who convert do immediately after (e.g. do they immediately login?)
- What do people who don’t convert do next (e.g. do they leave the site or go to a different page?)
Tracking these key actions will give you insights into the journey of people who convert vs. those who don’t. With this information, you can make changes to your web property so you can get more people to convert.
Marketing Campaign KPIs
While tracking key actions that happen on your web property, it’s also important to track your digital marketing campaign KPIs or Key Performance Indicators that start off of your web property.
Advertising Campaigns
- Campaign tracking - number of people who click an ad to go to your site.
- Campaign Automation - add visitors to external marketing applications.
- Conversion rate - percentage of people who click an ad and convert on a goal.
- ROI - the total revenue generated by different campaigns.
Email Campaigns
- Open rate - number of people who open an email.
- Click-through rate - number of people who click on a link in an email.
- Unsubscribe rate - percentage of people who receive an email and unsubscribe.
- Conversion rate - percentage of people who click on a link in an email and convert on a goal.
Email Automation
- Trigger email campaigns based on visitor behaviors.
- Does the email open rate get worse (or stay steady) as more emails are sent?
- Are people converting into upselling and cross-sell opportunities while in automation?
- Are people unsubscribing after receiving a certain number of emails?
Remarketing
- Automation - remarket to specific visitors based on their behavior on your site.
- Click-through rate - how many people click on a remarketing ad.
- View-through conversion - how many people who see a remarketing ad then go on to convert (without clicking on the ad itself).
This list is not comprehensive! Depending on the type of marketing and advertising campaigns you’re running, you may track more (or less) than the metrics suggested here.
Automation
Automating tasks based on visitor behavior is the other side of the coin for web analytics. Now that events are being tracked, taking action on these events can increase conversion rates and aspects of your sales cycle.
Tracking the performance of your automations is also key to making sure your business is running like a well-oiled machine.
Automations to review include:
- Setting emails based on visitor behavior
- Performance of automated emails.
- Remarketing campaigns to Google Ads and Facebook Ads
- Measuring the effectiveness of these remarketing campaigns
- Updating leads in your CRM based on key usage of your visitors
Setting up these automations and keeping tabs on these metrics is important for a couple of reasons.
First, basing automation on visitor behavior on your site takes the guesswork out of who to target and allows you to focus on specific segments of users.
For example, you could set a retargeting campaign to send events to Google Ads remarketing for users who clicked a particular product but didn’t end up making a purchase. Then, you’ll want to measure how well the retargeting campaign is working.
Secondly, if you’re using a CRM, automation can update leads, convert them to opportunities, and provide your CRM and sales team with vital information around a visitor’s behavior.
These are just a few examples of how automation can provide the necessary functionality to help your sales and marketing teams. Most analytic tools are lacking in the automation side of things.
However, Woopra’s all-in-one solution provides both making it easy to analyze your data and then take actionable steps based on the data being collected
Optimize for Conversion & ROAS Now! Explore Woopra in a demo and enjoy a 2-week free trial: https://www.woopra.com/demo
Web Analytics Examples
Below, we’ll review a few real-world web analytics examples.
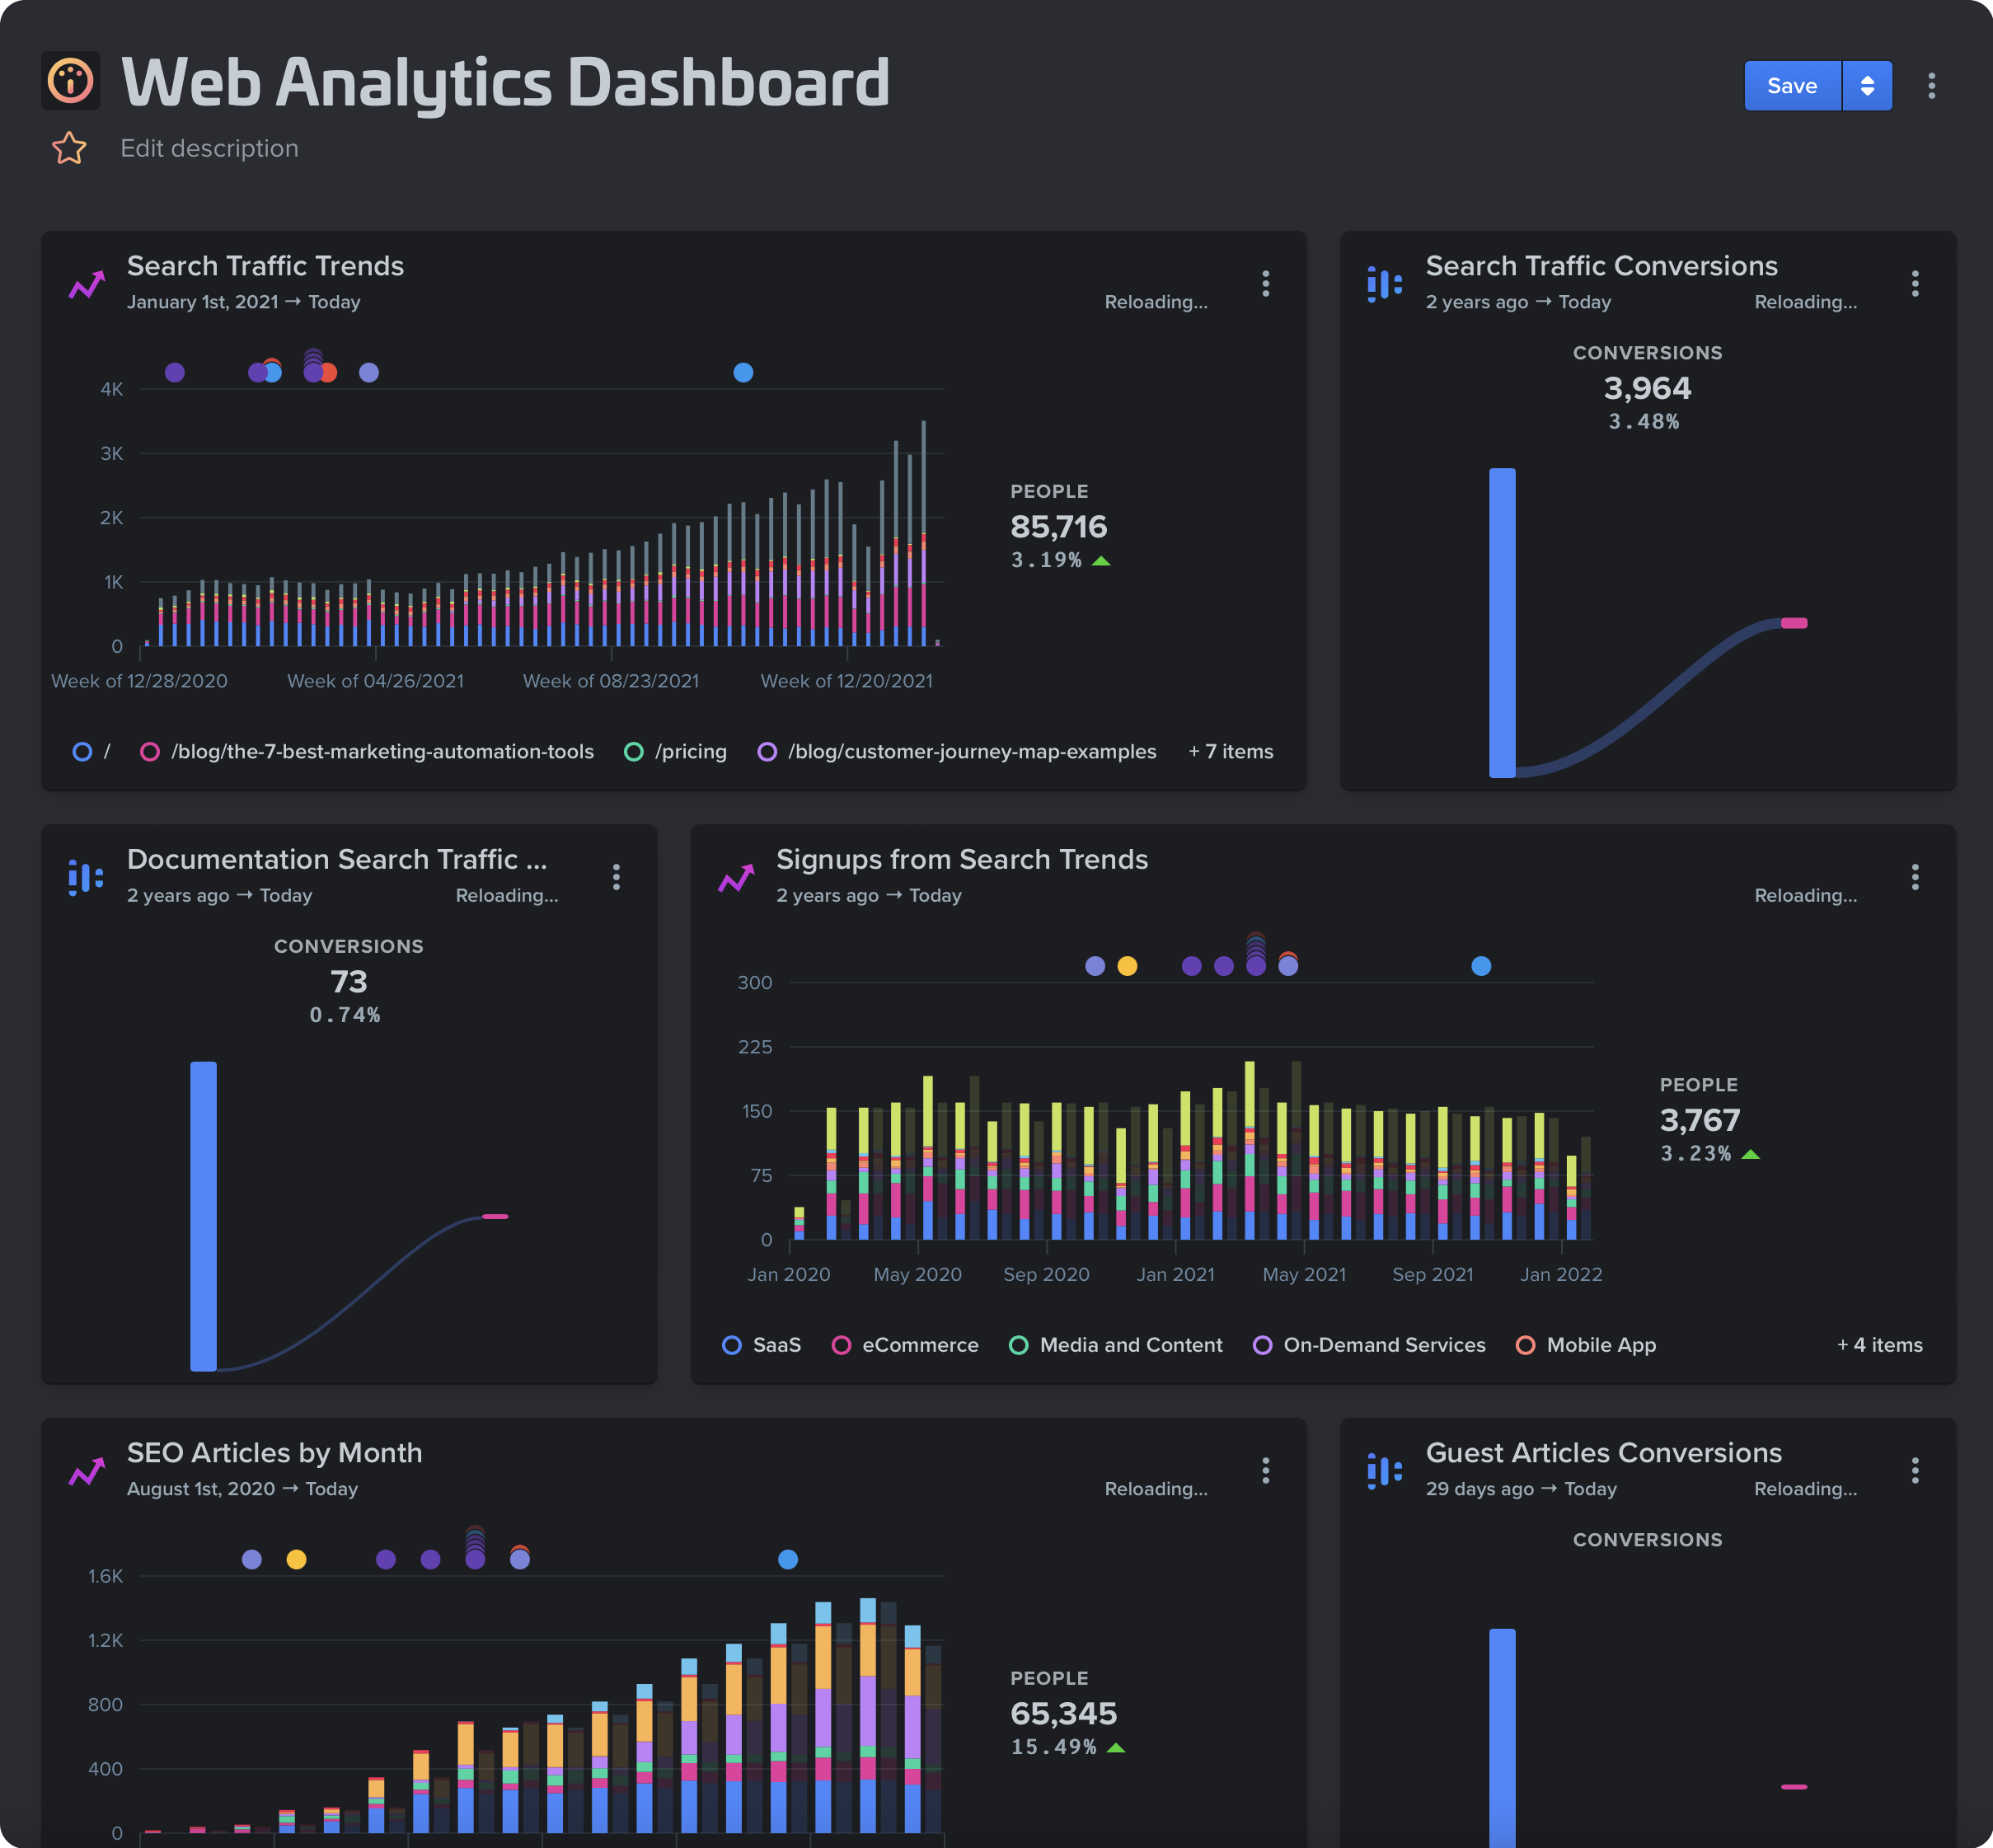
Website Analytics Dashboard

When looking at a website analytics dashboard there are a lot of website data metrics you can review, but key metrics include the number of users, new users, conversion rates, registrations, sales and product usage.
Dashboards are excellent for viewing high-level key metrics at a glance. However, having specific reports for different types of analysis is especially useful when analyzing your data.
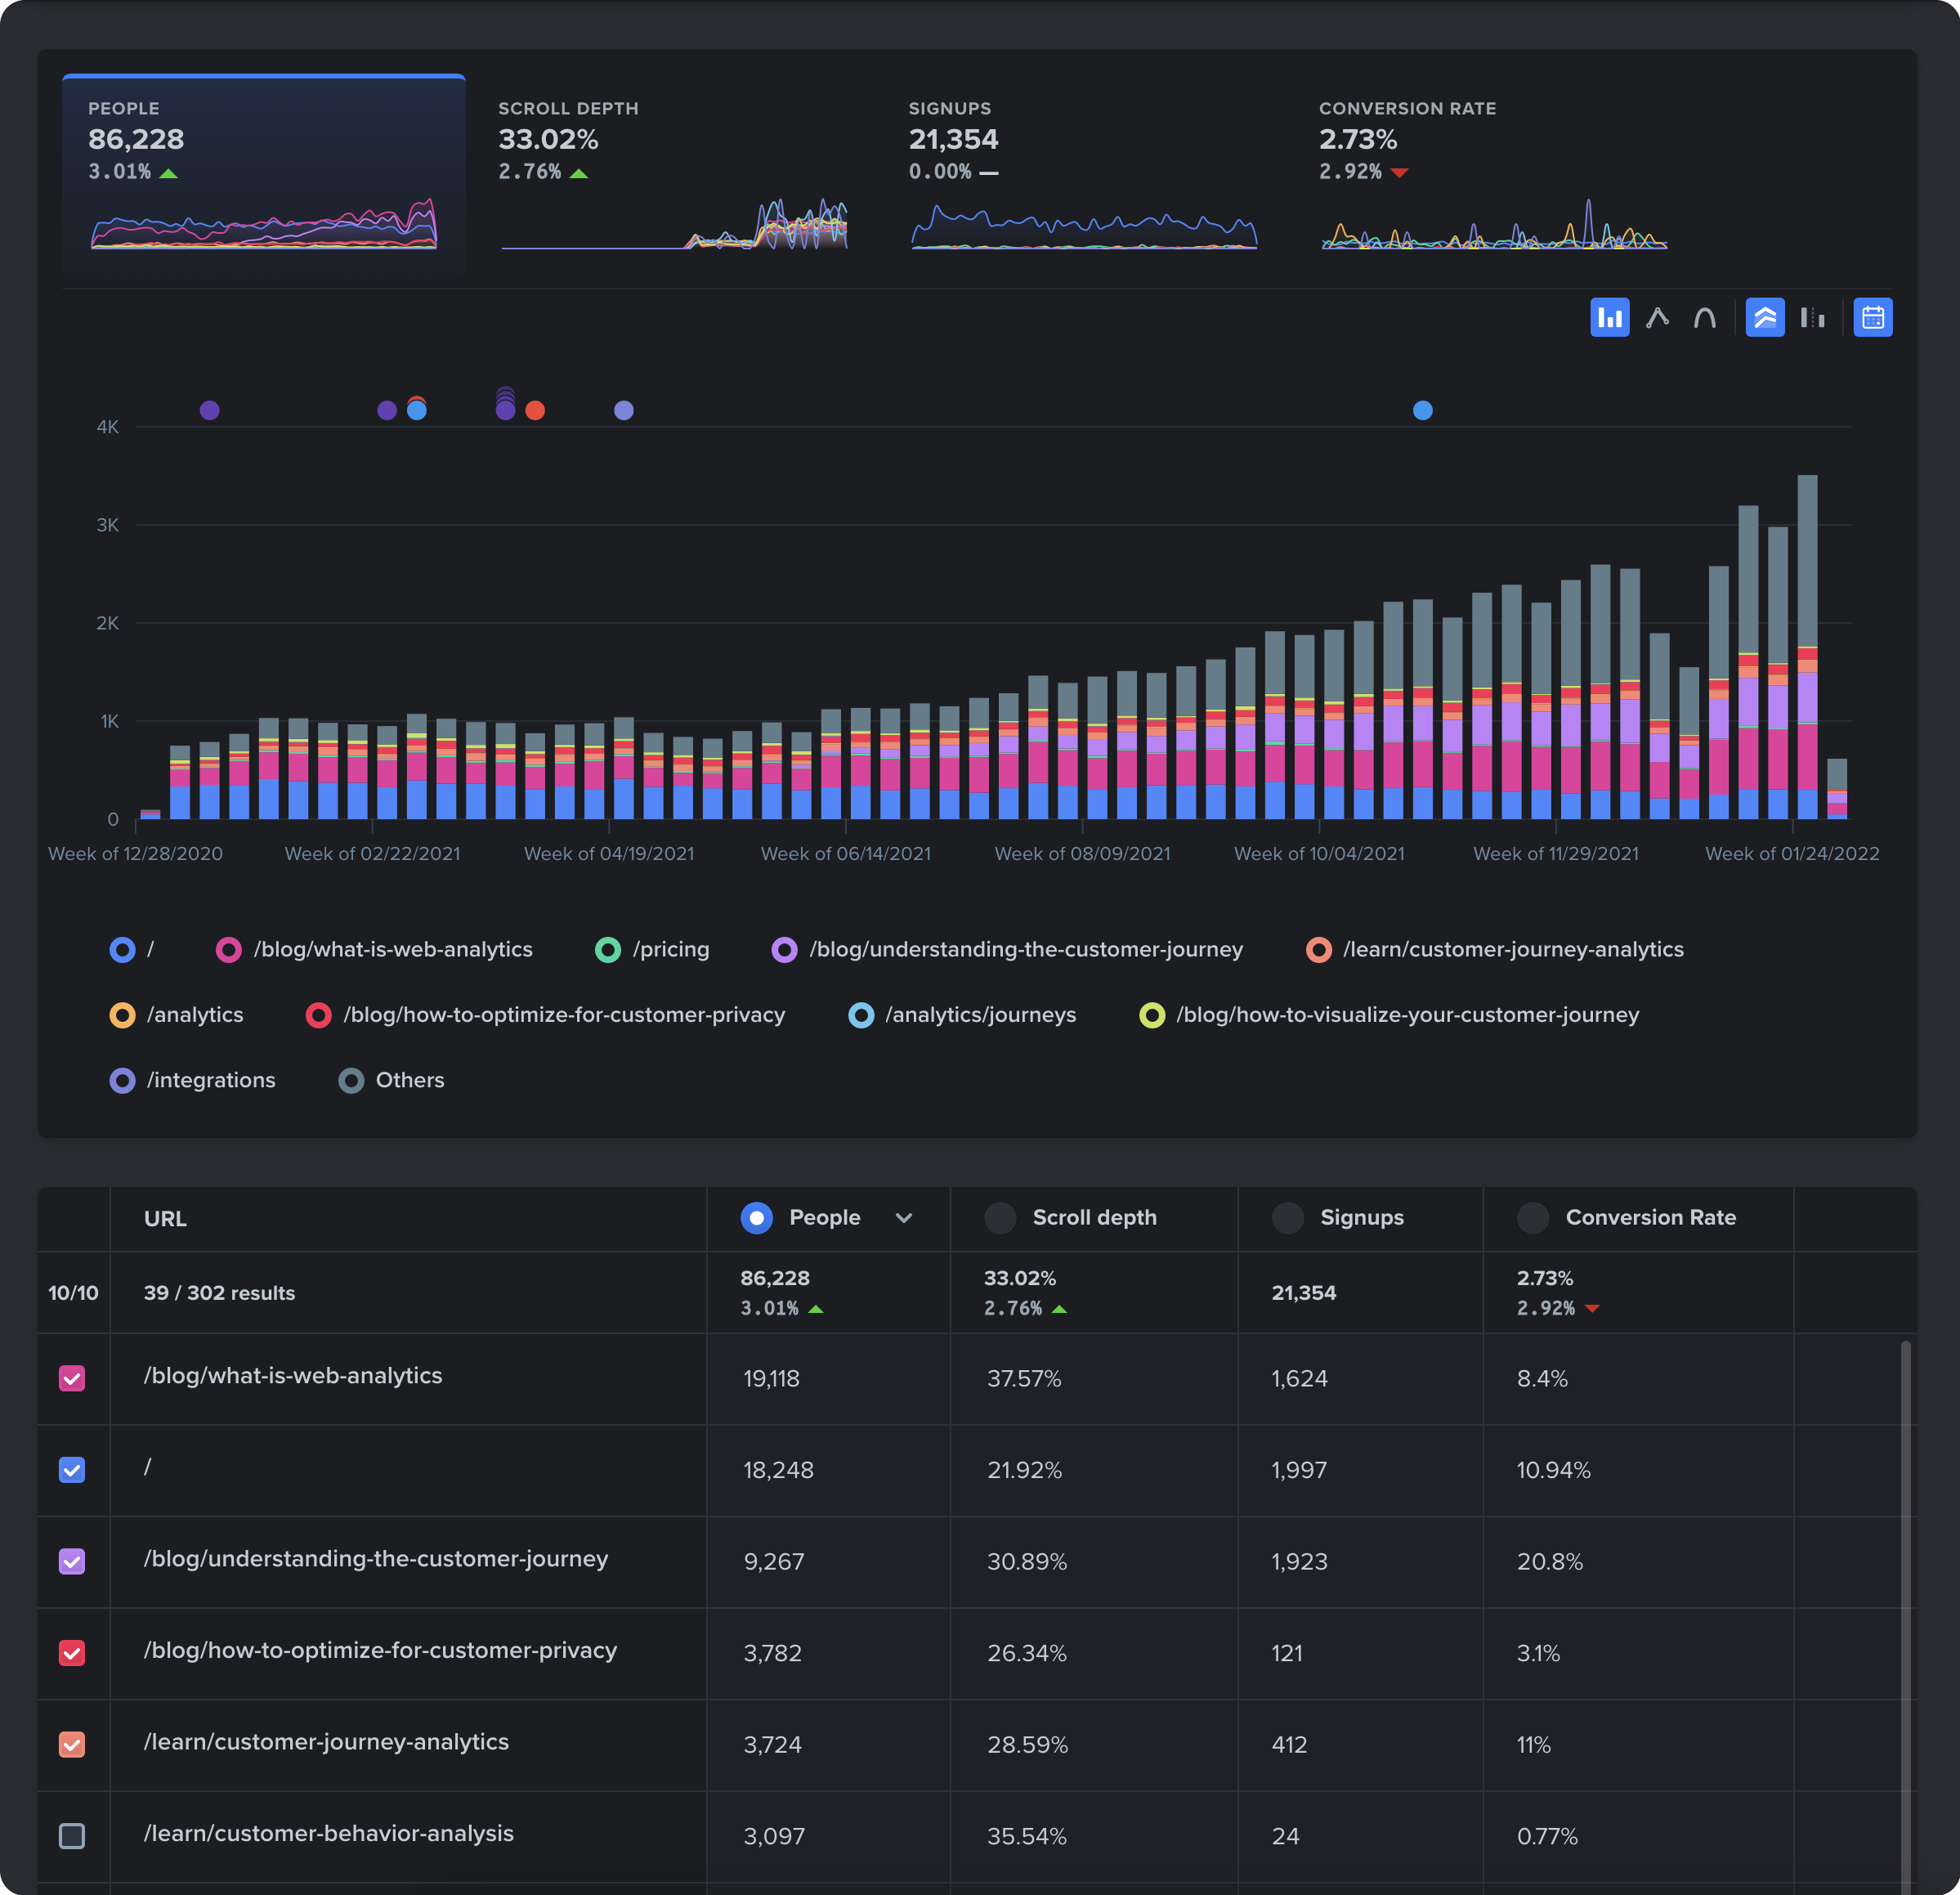
A typical Trends report can track the performance of or events over time, such as sales, campaigns, and traffic sources, to name a few. Below we can see an example of which pages users are visiting first that specifically came from a search engine.

In this example, we can see that the majority of users are landing on our homepage followed by our blog post and pricing page.
With this information, we can choose to put more focus on our blog pages which could help with our SEO. We could then also track conversion rates from our blog posts to further enhance them.
Without reviewing website analytics like this, we would not have actionable insights into what pages our search traffic is viewing, and wouldn’t have strategic insight into where to allocate your budget or time focus.
Journey Reports
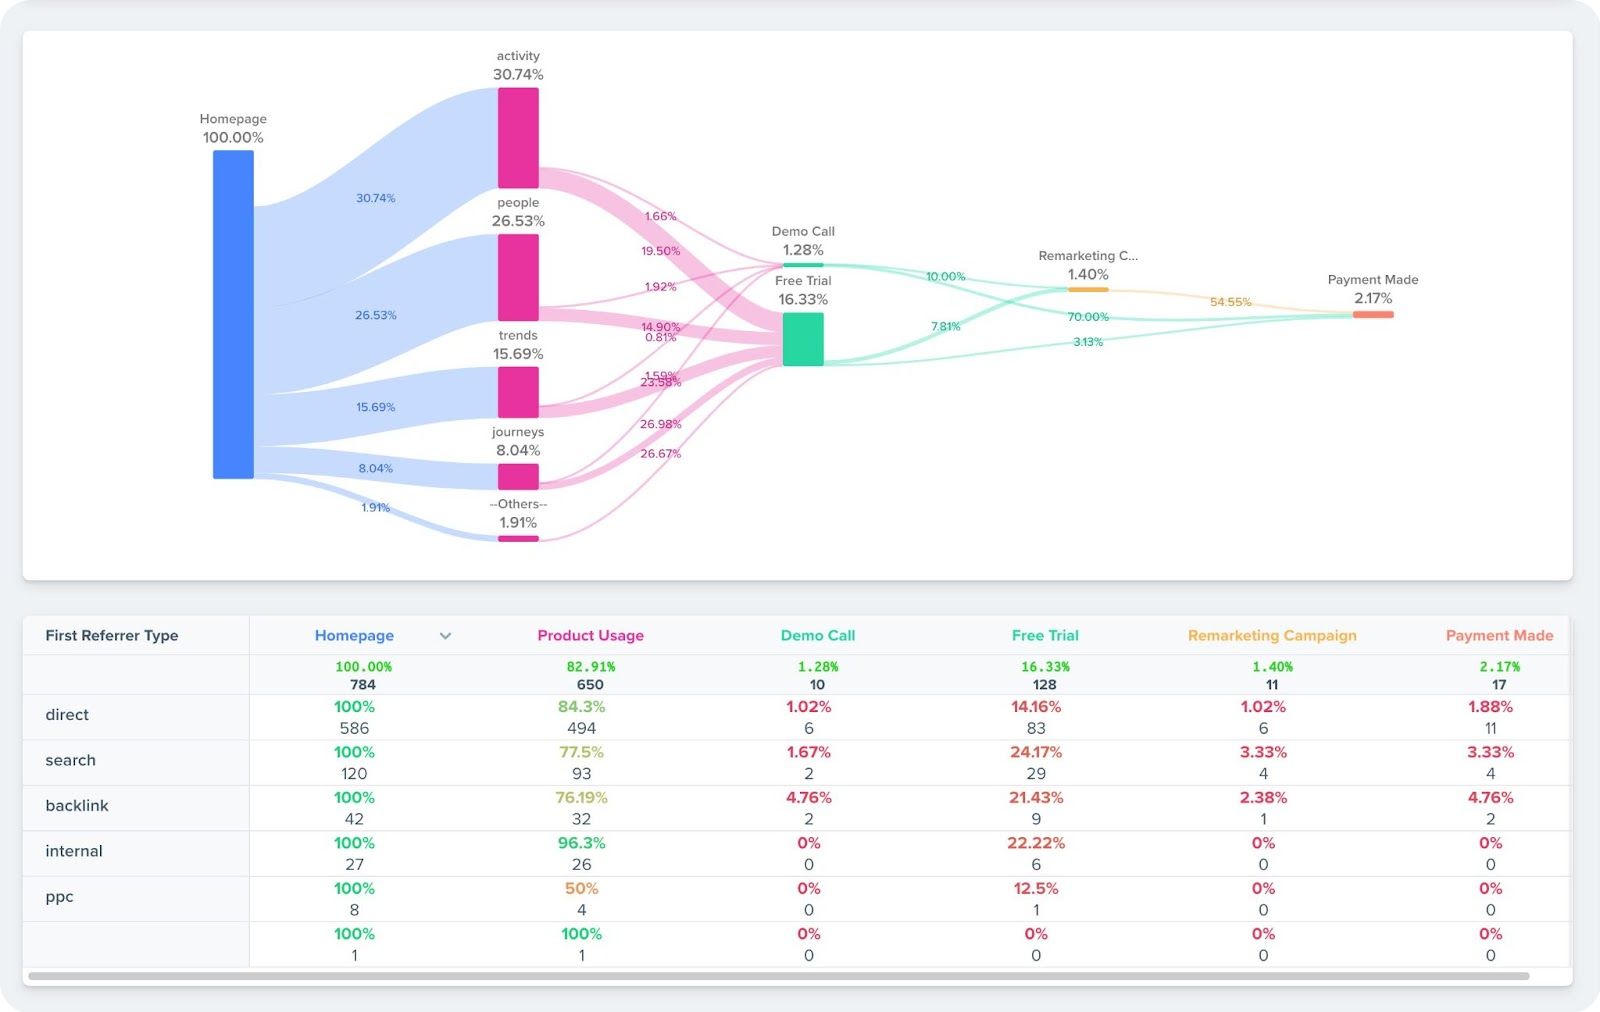
In addition to Trend reports, Journey reports also serve a key purpose. These reports are used to analyze specific funnels or paths that your visitors take. The below example examines the user journey from landing on the homepage, interacting with the product, starting a free trial or attending a demo call, remarketing campaigns, then finally making a payment.

This report clearly shows most people are opting to start a free trial after using the product instead of booking a demo call.
However, we can see that the conversion percentage for making a payment after a demo call is much higher than users starting a free trial. 70% of users who had a demo end up making a payment vs. only 3.13% of users who started a trial.
With this information, we can choose to put more focus on scheduling demo calls to increase our overall conversion rate.
Without Journey analytics, you would not know which paths are performing best and would have to make decisions based on our gut feeling, which isn’t always reliable.
Ad Performance
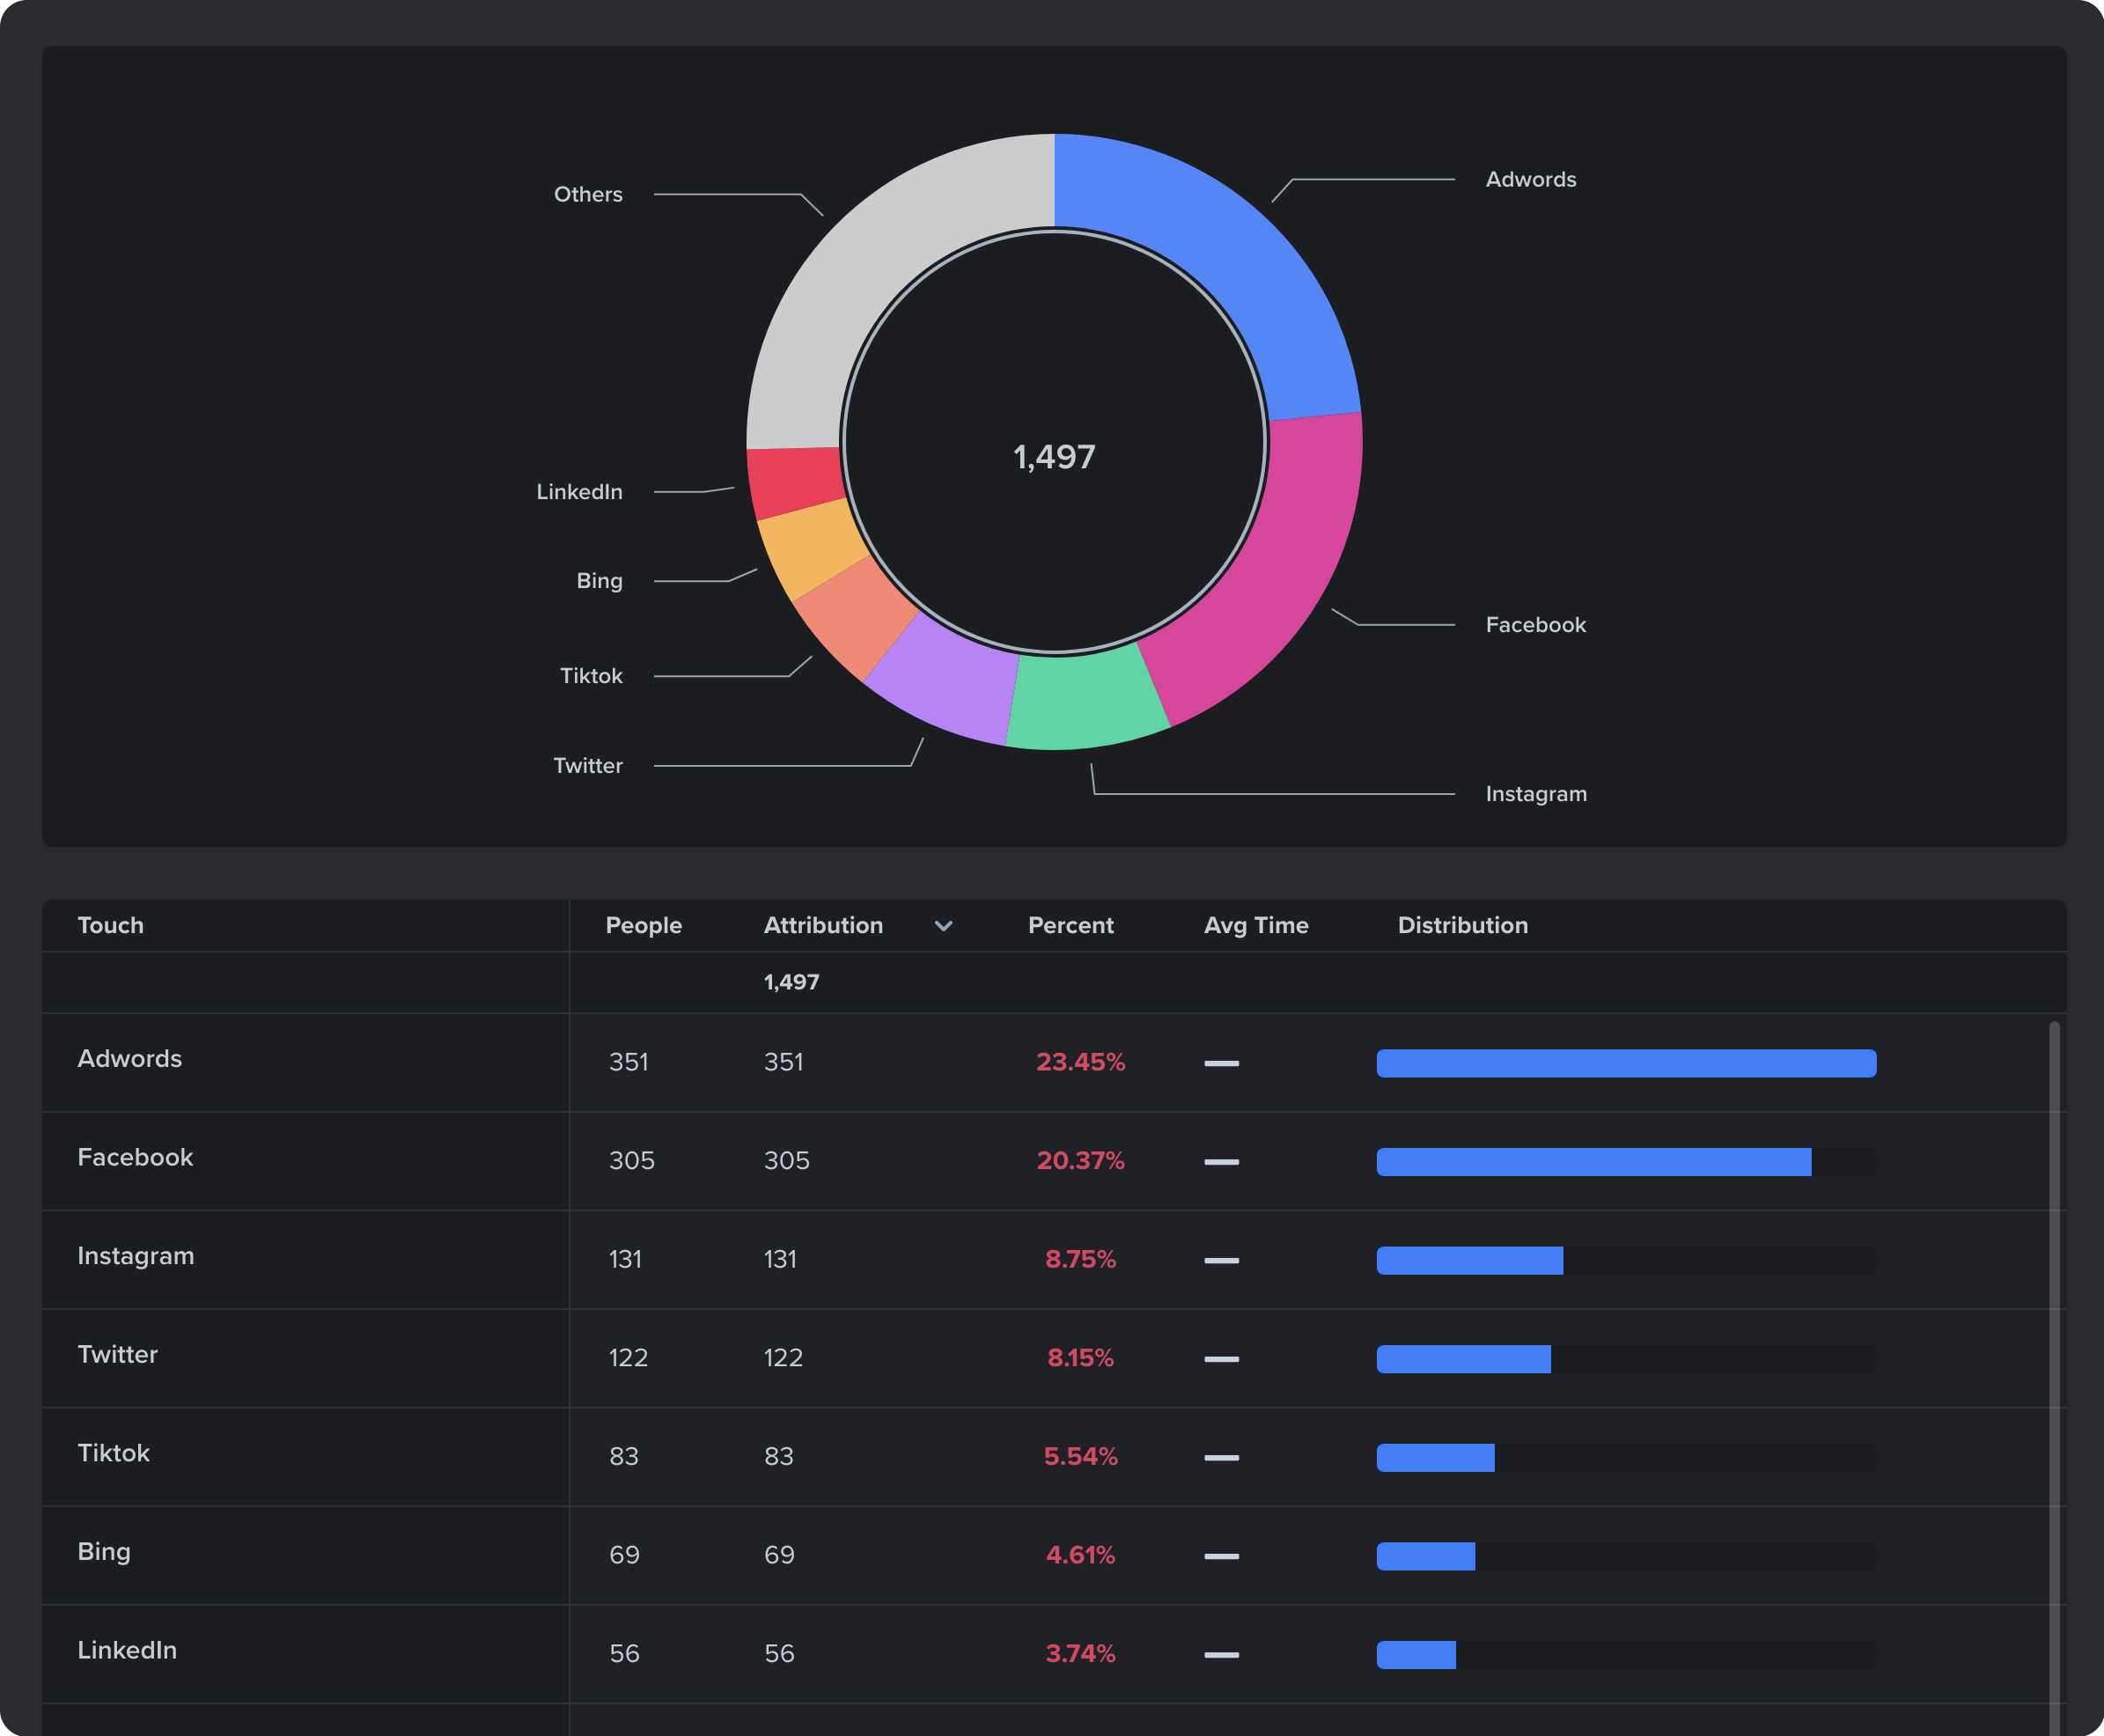
Another metric to monitor is ad performance on conversions. With an Attribution report, we can clearly see which channels are working the best for our conversion numbers.

In this example, we’re analyzing which campaigns or touchpoints are performing the best for signups. We can see Adwords is the clear winner, therefore it makes sense to allocate a larger budget for this particular channel instead of the others.
By reviewing these metrics, you know exactly which campaigns are working and which aren’t to help make the most informed decisions to get the highest return on your investments.
Types of Web Analytics
There are two primary types of web analytics: on page and off page. Both will provide key insights to help you optimize your user journey.
On Page Web Analytics
On page analytics relates to tracking activity that happens on or within your web property.
This might include how many people watch a software demo, subscribe to your email list, take advantage of a free offer, engage with key features of your site or software, or even convert into a customer.
Off Page Web Analytics
Off page analytics refers to activity that happens off of your web property.
This mostly refers to the actions people take to get to your web property, such as clicking on an ad on a search engine or clicking on an email.
When it comes to your off page web analytics, you’ll primarily be analyzing metrics such as marketing email sent, open rate, and click-through rate.
These metrics help you choose the right channels, messaging, and targeting to get ideal future customers to your site.
Top Web Analytics Tools
There are many different web analytics tools out there to help you track key business and marketing metrics to put together a custom report.
Here is a list of some top tools and what they offer:
- Google Analytics - this free and general web analytics tool can help you track on-page activity for your web property, but all of the data will be anonymous. While this tool is free, you may be wondering “How accurate is Google Analytics?” You may be surprised.
- Woopra - this low-cost tool can help you track on-page activity for your website but also gives you a detailed insight into individual customer experiences. It integrates with all of your favorite marketing tools and can trigger advanced automations based on any user action that you can identify. Read more about Woopra here.
- Adobe Analytics - is a high-cost enterprise tool that is very customizable but has considerable implementation challenges. Read how GA, Adobe and Woopra compare here.
- Mixpanel - is a paid tool more focused on mobile and product analytics. For marketers or journey analytics, it may or may not be a useful tool. It depends on your specific use case and the marketing metrics you need to measure.
If you’re looking to create a tech stack of the best web analytics software, these are the gold standard options. With these tools, you can track all of the important metrics needed to move your business forward based on real-world data.
Read the other articles in our Intro to Web Analytics series:
- The Best Web Analytics Tools (2024)
- The Most Important Web Analytics Metrics to Track in 2024
- How Much Does Web Analytics Cost in 2024?


