With more than half of today’s consumers saying they’ll switch to a competitor after a single bad customer service experience, it’s crucial to get customer service right.
A great starting point for doing that is utilizing customer service data analytics to analyze a mix of quantitative and qualitative customer data.
This provides you with valuable insight that you can use to make data-driven decisions to dramatically improve the overall customer experience.
Here’s everything you need to know, along with use cases, customer service metrics to track, and more.
What is Customer Service Analytics?
This is a type of customer analytics tool that measures customer service experiences and interactions to produce insights into what you can do to optimize customer service.
Customer service analytics can tap into a variety of customer data sources, including:
- Phone calls
- Texts
- Emails
- Chat support transcriptions
- Customer feedback surveys
- Social media
- Self-service resources
For example, you may analyze the average call wait time before customers speak with a customer service rep. You may also determine the average length of time it takes before an issue is resolved.
Or you may see what percentage of customer inquiries are resolved upon first contact without the need for a follow-up.
Customer service analytics is extremely helpful, as understanding this aspect of customer behavior sets the stage for improving overall customer interaction, reducing customer churn, providing a better product experience, increasing the average customer lifetime value, and more.
And looking long-term, it can play a vital role in increasing customer success, boosting customer loyalty, and improving your overall bottom line. If you haven’t leveraged this type of customer analytics yet, now is the perfect time to do so.
Customer Service Analytics Use Cases
There are countless ways to use this form of customer engagement analytics, but let’s take a look at some specific ways it can help your business.
1. Determine How Customer Service Impacts Conversions
When most people envision utilizing customer service analytics, they think post-sale.
But it can also be used pre-sale to figure out the effect customer service has on conversions.
If, for example, live chat was a central part of your customer service, you could see what impact it had on conversions by measuring what percentage of first-time visitors started a live chat.
Then, you could measure what percentage of those visitors signed up for a free trial and ultimately, how many upgraded to a paid version of your product.
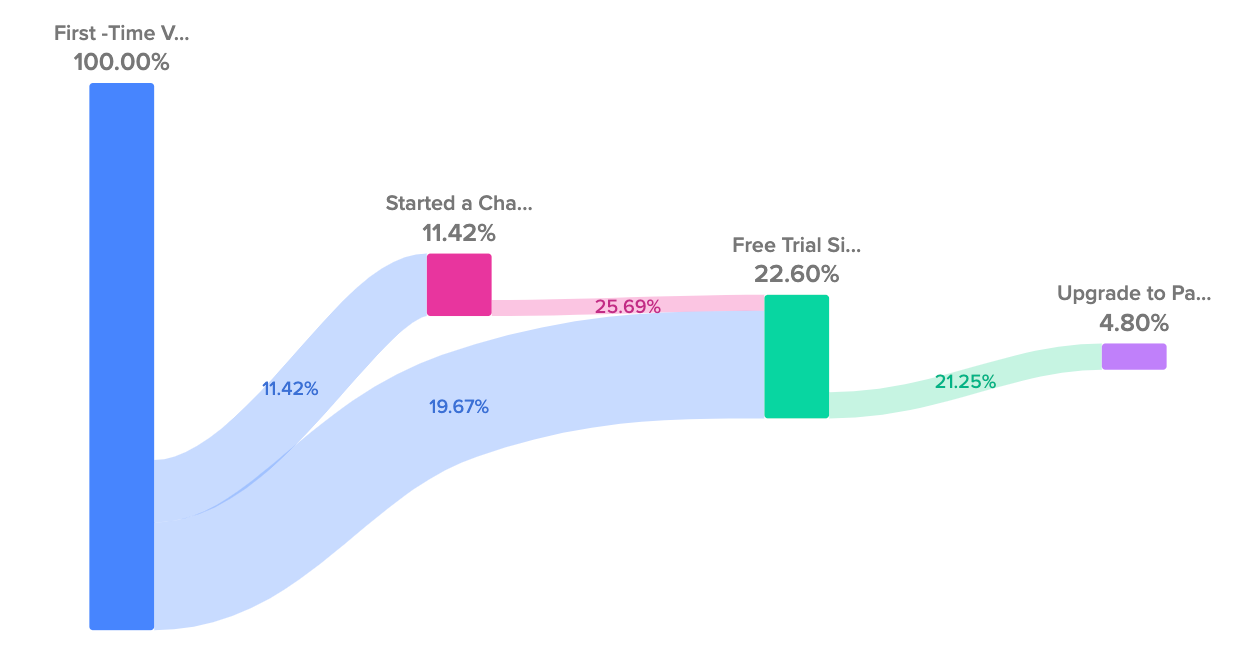 Using customer data analytics for this purpose should help reduce customer service friction points prior to the sale, which should result in more leads buying.
2. Improve the Average Customer Service Response Time
Modern customers have high expectations with customer service response time.
Research has found that “46% of customers expect companies to respond in less than four hours,” and “12% of customers expect a response within 15 minutes or less.”
This applies to outreach methods like email and social media.
As for phone response time, call center analytics experts say calls should ideally be answered within 20 seconds. However, 46 seconds is the norm across all industries.
When expectations aren’t met, 52% of customers say they’ll take their business elsewhere. By measuring average customer service response time on emails, phone calls, chat, and so on, you can determine if your response time is up to par or if it needs to be improved.
3. Identify Key Areas for Product Improvements
Another use case involves zooming out and looking for common customer complaints so you can accurately pinpoint product issues that require your attention.
That way you can efficiently prioritize your efforts to ensure you’re addressing the right areas to better utilize your time and resources.
Further, if you spot recurring issues among customers that go beyond your product (website UX problems would be a good example), you can take measures to resolve those as well.
4. See How Customer Service Impacts the Customer Journey as a Whole
Needless to say, customer service heavily influences how consumers perceive your brand and the overall customer journey.
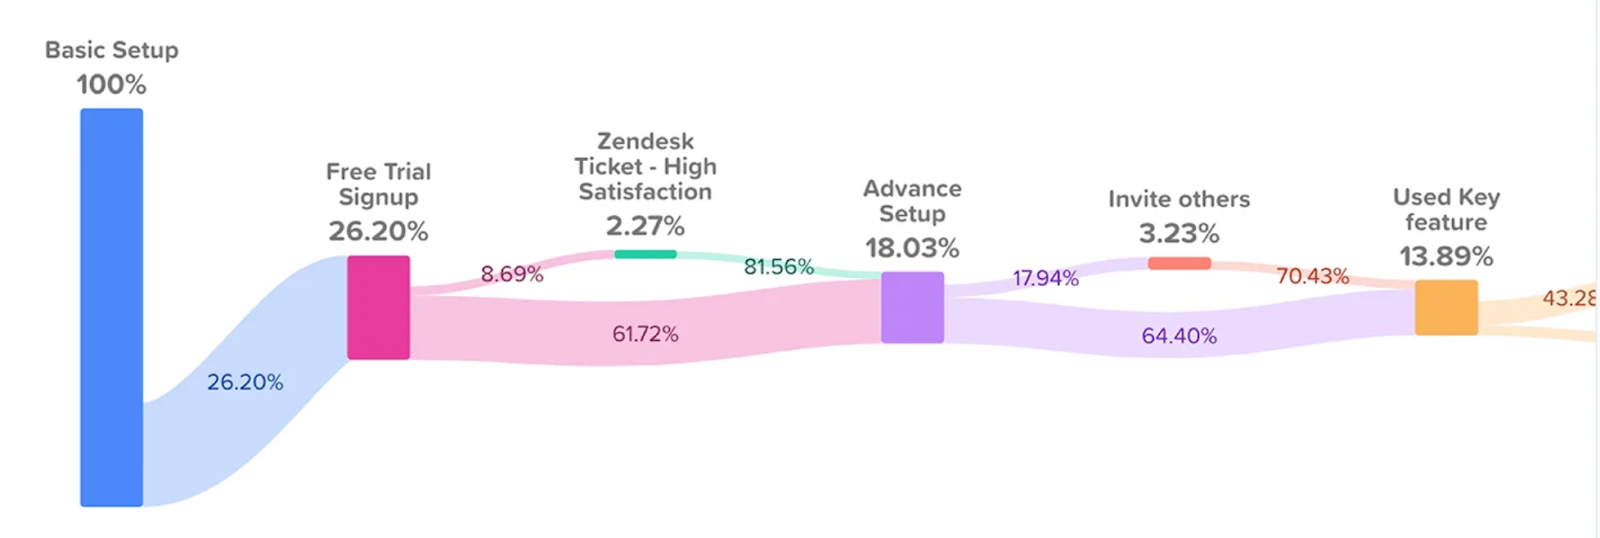
Another way to put customer service analytics to use is to map the entire customer journey end-to-end to better understand how customers move throughout the various touchpoints, as well as areas of friction.
For example, you could track the customer journey from the moment someone performs a basic product setup to using a key feature and customer service moments along the way like creating a customer support ticket.
Further, you could see what percentage of support tickets resulted in high customer satisfaction.
5. Determine How Customer Support Tickets Affect Net Promoter Score
Your Net Promoter Score is a leading indicator of customer loyalty, as it measures the likelihood that customers would recommend your business to others.
And a key contributor to your Net Promoter Score is customer support — something that can also be measured with customer service analytics.
For instance, you could use it to see what percentage of customers resulted in a positive Net Promoter Score after contacting customer support.
 If that number was lower than it should be, it would indicate that changes need to be made. However, if it was higher than average, this would likely indicate a positive customer experience and that customer needs are being met.
Customer Service Metrics Worth Tracking
When it comes to measuring the quality and effectiveness of your customer service, there are some specific customer metrics you’ll want to prioritize.
The following should provide a bird’s-eye view of the current state of your customer service and help you identify particular areas where you may need to make changes.
1. Average Response Time
One of the biggest factors in determining customer experience is the average response time, which makes it a crucial customer service metric.
Generally speaking, the shorter the response time, the higher the customer satisfaction, and vice versa.
This should be measured across all your main customer service communication channels, such as email, phone, social media, chat, and so on.
If your average response time is higher than it should be, it likely means there are inefficiencies that need to be addressed.
2. Average Resolution Time
While average response time shows you how long it takes you to respond to customer inquiries, average resolution time shows you how long it takes to answer a question or solve a problem.
In other words, this is the amount of time that occurs from the initial contact to a resolution.
Just like with average response time, there’s a strong correlation between a fast average resolution time and a better customer experience.
Therefore, if your average response time is low, changes likely need to be made.
3. First Contact Resolution
Ideally, a customer’s inquiry will be resolved on the first contact without the need for additional follow-ups.
When this happens, it’s called first contact resolution — something that correlates with your Customer Effort Score, which measures how easily customers can get customer service and resolve an issue they’re facing.
Getting issues resolved the first time around with the maximum percentage of customers is important because it:
- Increases customer satisfaction
- Improves customer experience
- Lowers churn
- Reduces operational costs
- Improves your Net Promoter Score
So what’s considered a good first contact resolution rate?
According to research, 70-79% is considered good, while anything above 80% is considered world-class.
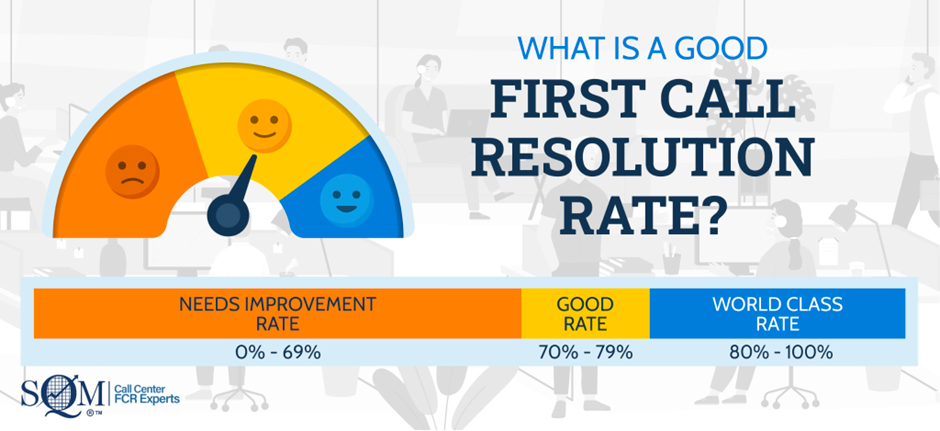 Source: Alexander Jarvis
Therefore, you’ll usually want to aim for at least 70% to begin with. And as you gain actionable insight with customer experience analytics, you’ll want to strive to raise it to 80% or higher in time.
4. Customer Service Abandonment Rate
Abandonment rate is the percentage of customers who abandon their customer service interaction before their issue is resolved.
As you can see from this graph, when there’s a low abandonment rate, customer satisfaction tends to be fairly high.
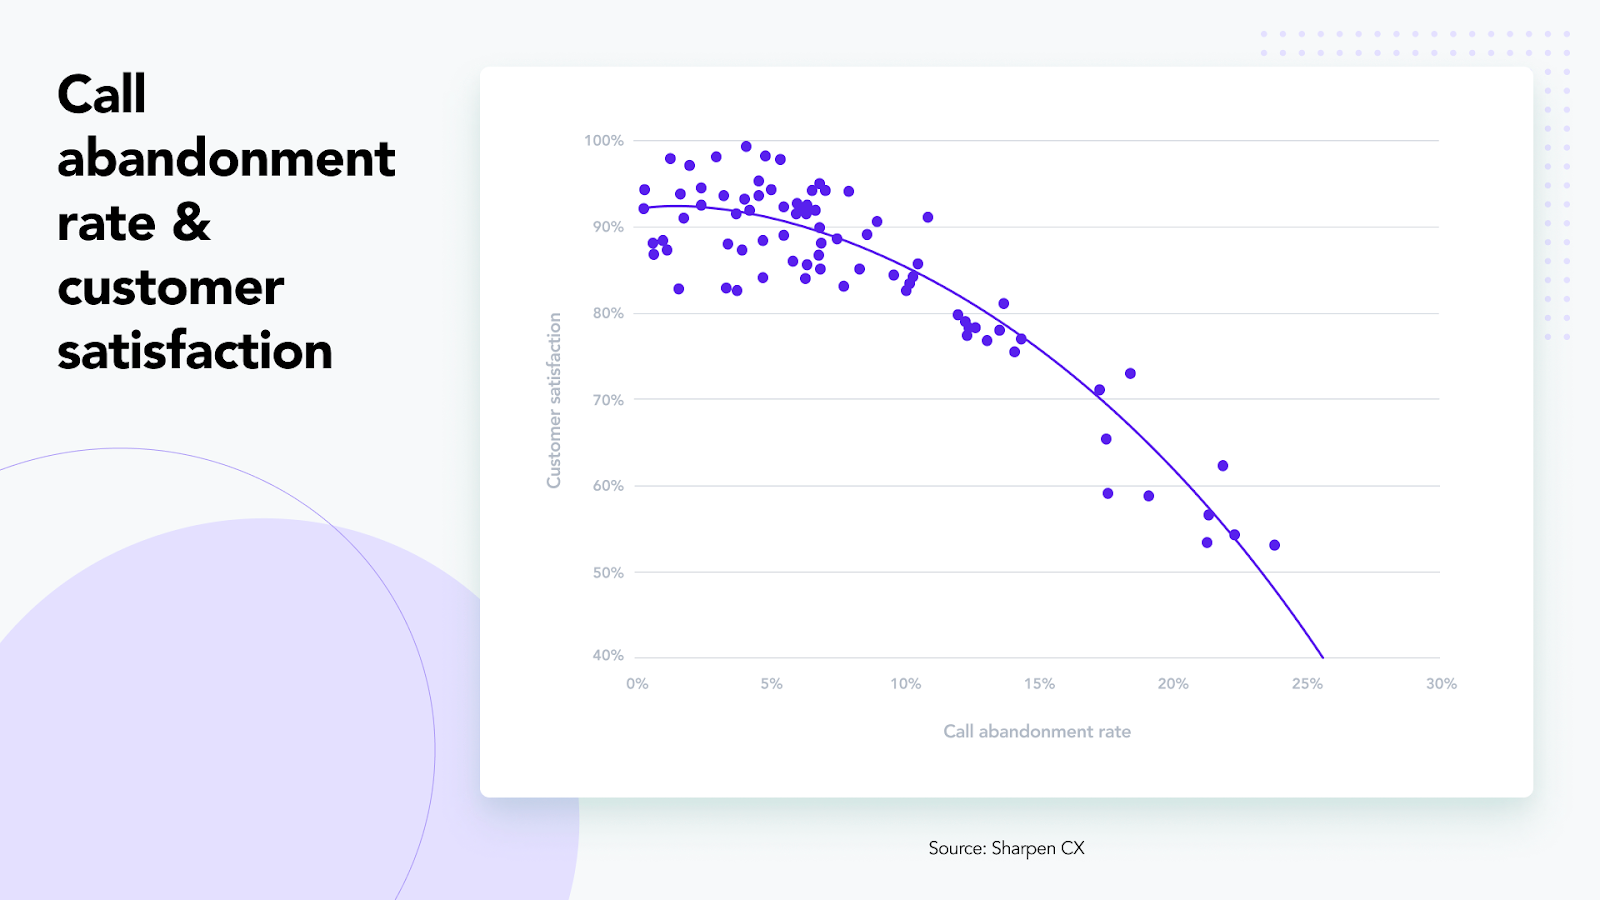 Conversely, when there’s a high abandonment rate, it can wreak havoc on customer satisfaction and cause it to plunge.
If left unchecked, a high abandonment rate can be incredibly toxic and erode the customer experience, harm your Net Promoter Score, and significantly lower your overall brand equity.
Therefore, it’s important to stay on top of this customer experience metric and keep it as low as possible.
As for reasons why customers abandon customer service phone calls, here are some of the most common.
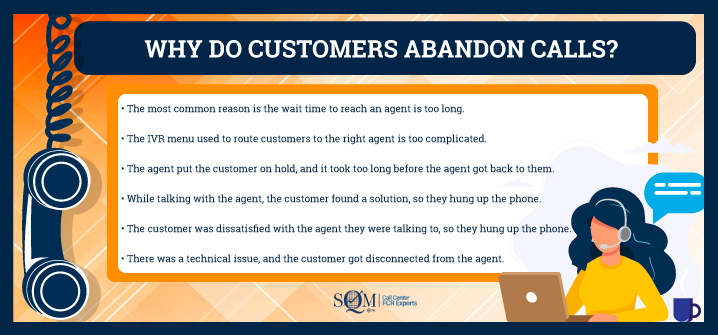 Source: SQM Group
5. Support Ticket Volume
Another revealing customer service data metric is the volume of support tickets you receive over a period of time for inquiries, complaints, and issues.
This can provide customer insight into things like:
- The frequency of product issues, UX problems, and other disruptions
- Common inquiries, complaints, and issues
- Customer self-service efficiency (if you offer self-service options such as a chatbot or digital knowledge base)
- Overall operational efficiency
If you have a high support ticket volume, it usually indicates problems with your product, UX, efficiency, or all three, which you’ll want to dive deeper into to find the root problem.
You can also analyze support ticket volume within the context of predictive analytics to identify when there are spikes in demand so you can increase manpower to keep up with it.
6. Customer Satisfaction Score
This measures the overall level of satisfaction among your customers within the specific context of customer service.
Typically, a score is generated through customer surveys where customers rate how satisfied they are by giving a score ranging from 1-5, with 1 being very unsatisfied and 5 being very satisfied.
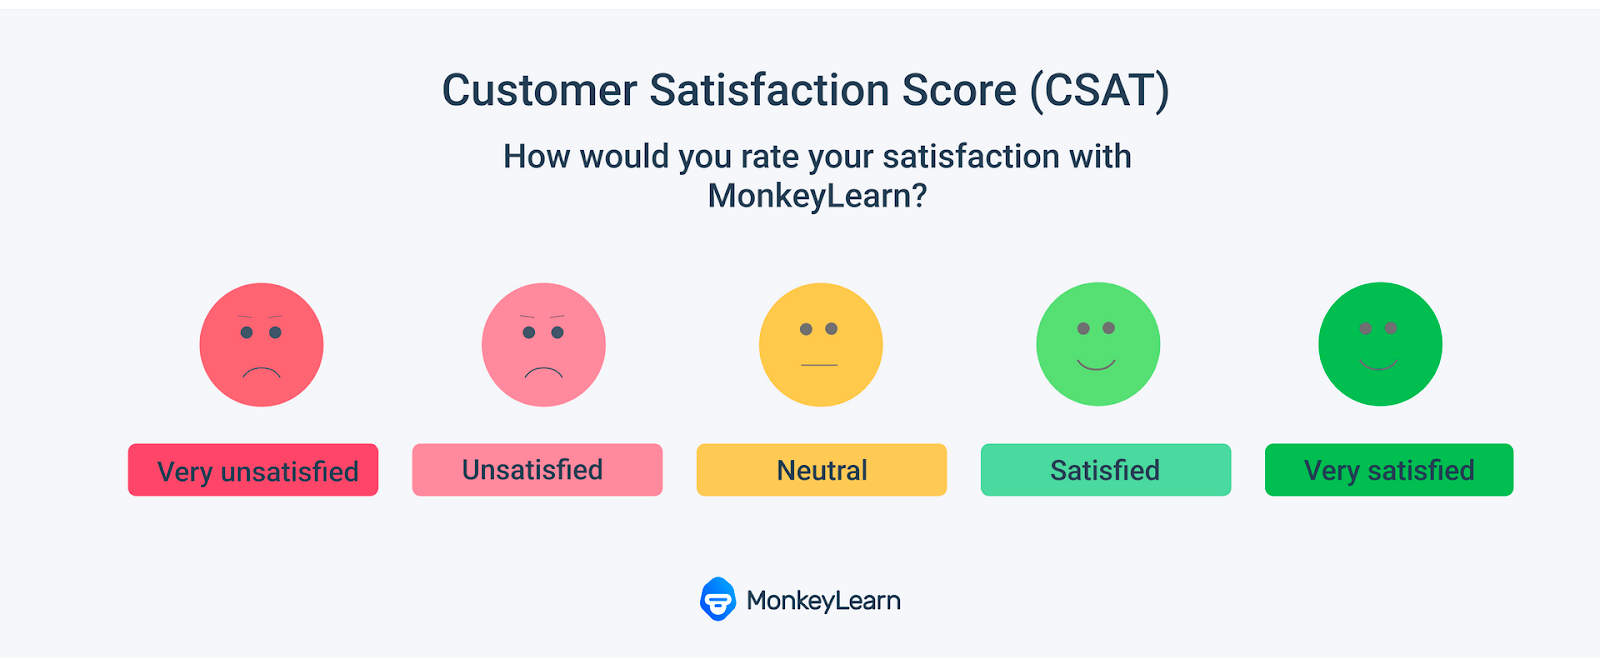 Source: MonkeyLearn
By performing customer analysis at scale, you can determine how positive or negative your customer sentiment is, which can lend insight into the overall customer experience.
Further, customer satisfaction analytics lets you know when changes need to be made.
When it comes to getting customer feedback, this is a simple yet effective way to do so.
7. Customer Retention Rate
While customer retention rate can be impacted by multiple areas of business operations, it’s fair to say that customer service significantly affects it.
If your customer retention rate is low, there’s a good chance that your customer service could use improvement.
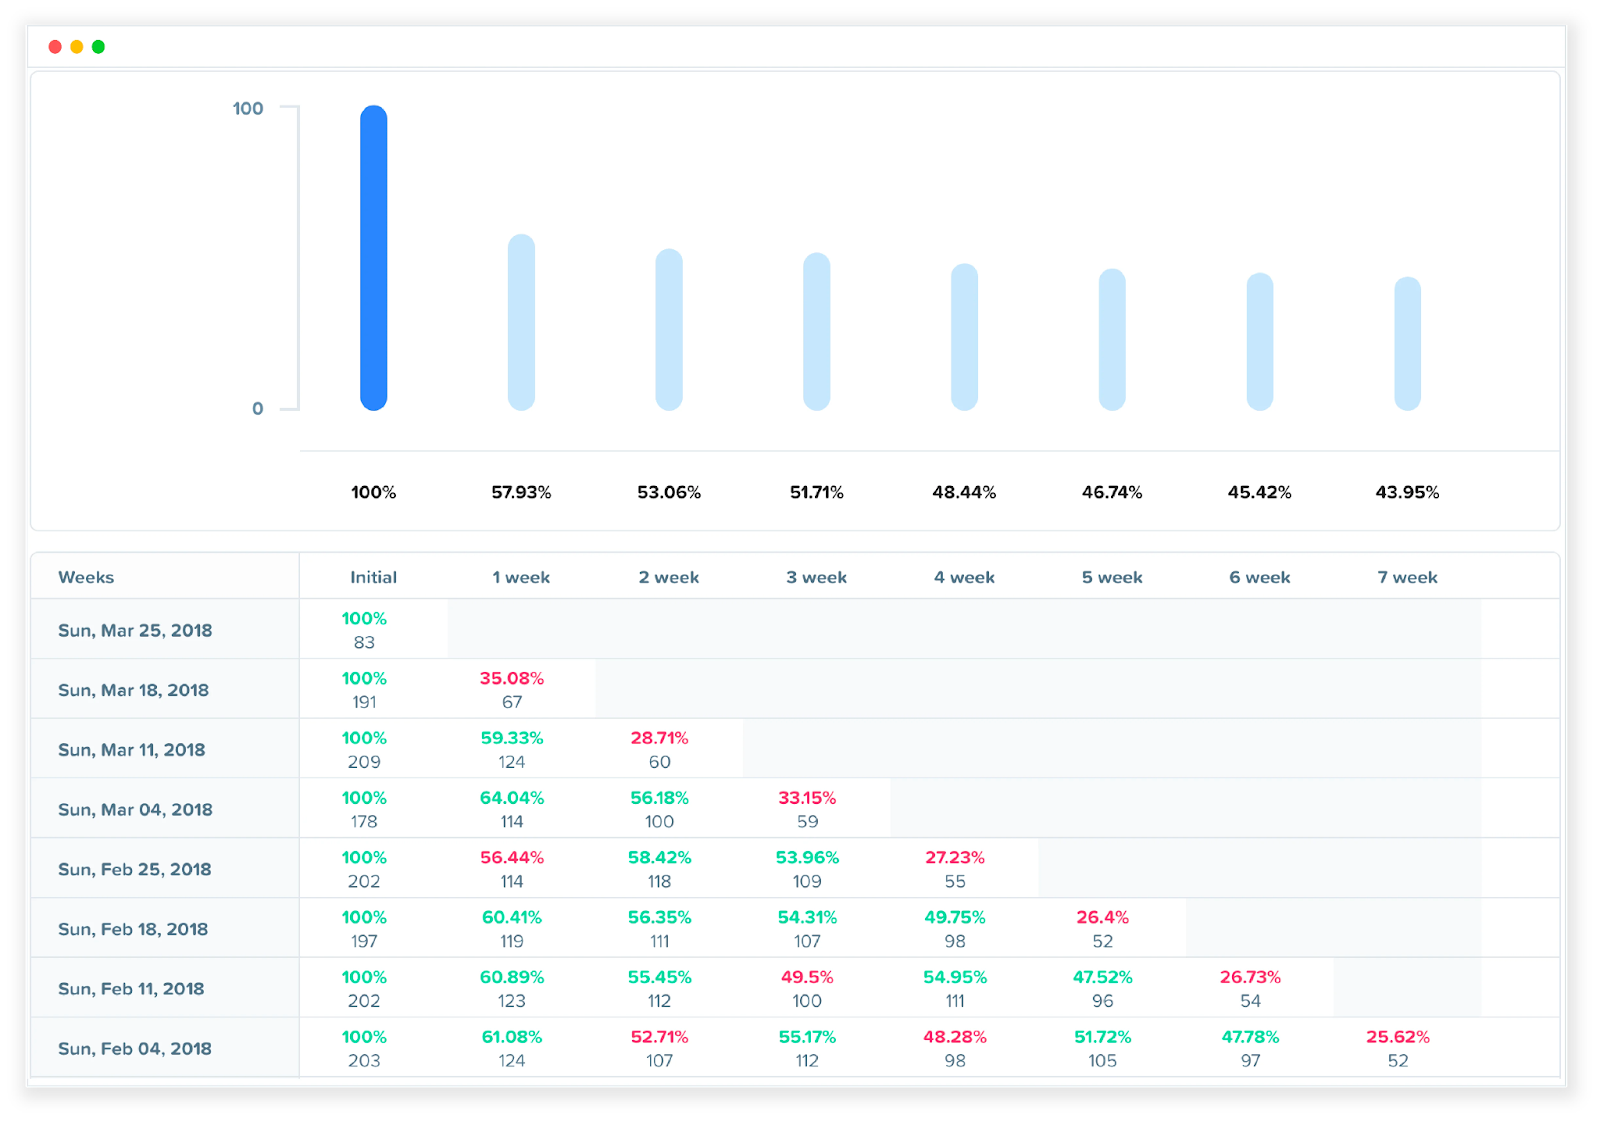
That’s why we suggest monitoring your customer retention rate over time to ensure it remains at a healthy level.
 Source: Woopra
Note that a certain amount of customer churn is normal (the average monthly churn rate in the SaaS industry is between 3-8%), but if it gets higher than that it means there may be customer service issues that you need to work on.
This brings us to our final section.
How to Use Customer Service Analytics Effectively
Customer service analytics has a lot of applications, but here are three of the best ways to put it to use.
1. Reduce Customer Churn
From decreasing your average response and resolution time to increasing your first contact resolution rate to boosting your customer retention rate and beyond, all of these things should culminate in reducing customer churn.
By performing customer service data analysis, it lets you know what your strengths and weaknesses are, which is the first step in optimizing what you’re doing right and correcting problem areas.
If, for instance, only a low percentage of customer issues are resolved during the first contact, that would be a top priority and an area you would want to strategically focus on.
For perspective, “67% of churn is preventable if the customer’s problem is resolved during their first interaction.”
But once you take measures to maximize your first contact resolution rate, the pieces should naturally fall into place where there’s a better overall customer experience, which should spill over into other areas of your business.
That’s just one example, and you should always be looking to keep customer churn at an absolute minimum through the use of advanced analytics.
2. Personalize Your Product Experience
Here’s an interesting stat.
“39% of customers say they won’t spend money on a business that doesn’t provide a personalized experience.”
However, if you can provide a personalized product experience, 80% of consumers are more likely to choose your company over a competitor.
One way to accomplish that is to use CX analytics to measure your customer satisfaction score to get an overall sense of how satisfied your current customers are with your product and identify specific issues they find problematic.
You could also look at common inquiries, complaints, and issues with your product, as well as get overarching customer feedback so you’ll know what to work on.
From there, you should be able to A) improve your product as a whole and B) create a more personalized experience that caters to the unique needs of your different demographics for more effective customer segmentation.
But it all starts with using data analytics to objectively measure the product experience.
3. Improve Customer Lifetime Value
What happens when you do things like shorten the average customer service response time, minimize your customer service abandonment rate, and boost customer satisfaction?
It creates a deeper sense of customer loyalty, which should, in turn, improve customer lifetime value.
This can have a huge impact on your business because increasing customer retention by just 5% can result in as much as a 25% profit increase.
When you’re able to retain customers for longer, this not only boosts your profitability because they keep using your product, it also means you don’t have to spend as much time and money on marketing to acquire new customers.
After all, research has found that “acquiring a new customer is between 5x and 25x more expensive than retaining an existing customer.”
When you effectively put your customer service data to use and follow best practices, increasing customer lifetime value should follow.
Looking for end-to-end customer journey analytics that provides comprehensive data analysis on customer service that goes beyond what Google Analytics can offer?
Check out Woopra. It can help your team objectively understand customer service, customer journeys, trends, retention, and more so you can make data-driven decisions and take real-time action.


