Google the phrase “marketing analytics,” and you get over 1.3 billion results!
This shows the level of interest and questions marketers have about it.
So in this post, we’ll dissect marketing analytics to show you everything you need to know about it, including what it is, why it’s important, and how to properly use analytics software.
What Is Marketing Analytics?
At its core, marketing analytics is the process of studying data to assess the performance of a marketing activity to reach an end goal. While marketing analytics can encompass anything that aims to enhance your marketing efforts, there are a few different types — web analytics, sales analytics, social media marketing analytics, customer journey analytics, and more.
If you ask 10 different marketers for a definition of marketing analytics, you’ll likely get 10 different answers.

Source: CleverTap. The folks at CleverTap define marketing analytics as having five main components.
It’s such a broad term that the exact definition can vary depending on who you ask.
One example is measuring engagement on a Google Ads campaign to maximize conversions and ROI. Another is evaluating UX performance to determine how user-friendly a website is and potential areas for improvement.
Or, in the long term, marketing analytics could be used to measure customer lifetime value (CLV) to improve your bottom line and maximize gross revenue.
Further, you can break it down into three primary categories, including descriptive analytics, predictive analytics, and prescriptive analytics, which you can learn more about the types of marketing analytics about here.
So as you can see, it’s very versatile and has nearly infinite applications.
Why Is It Important?
First, let me give you a few quick stats for perspective on the level of results digital marketing analytics can achieve.
28% of marketers that use a marketing analytics program say it helps them better measure their campaigns.
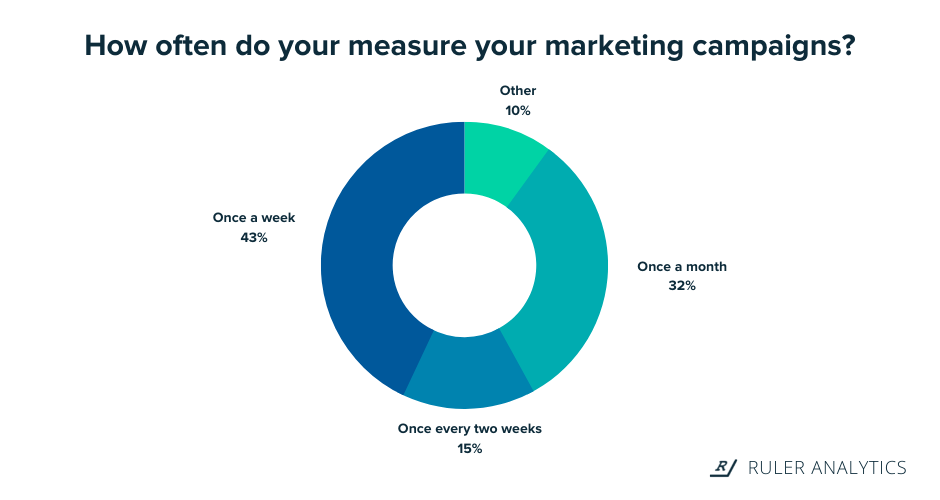
In fact, Ruler Analytics did a survey where they found that 43% of companies measure their marketing campaign performance at least once per week.
Source: Ruler Analytics
Marketers that use a robust marketing analytics tech stack are 39% more likely to see a measurable improvement in the overall performance of their marketing initiative.
And 54% of marketers that use data analytics see higher-than-average profits.
From effectively measuring marketing activity to improving campaign performance to increasing profitability, this data technology can have a profound impact on many campaigns.
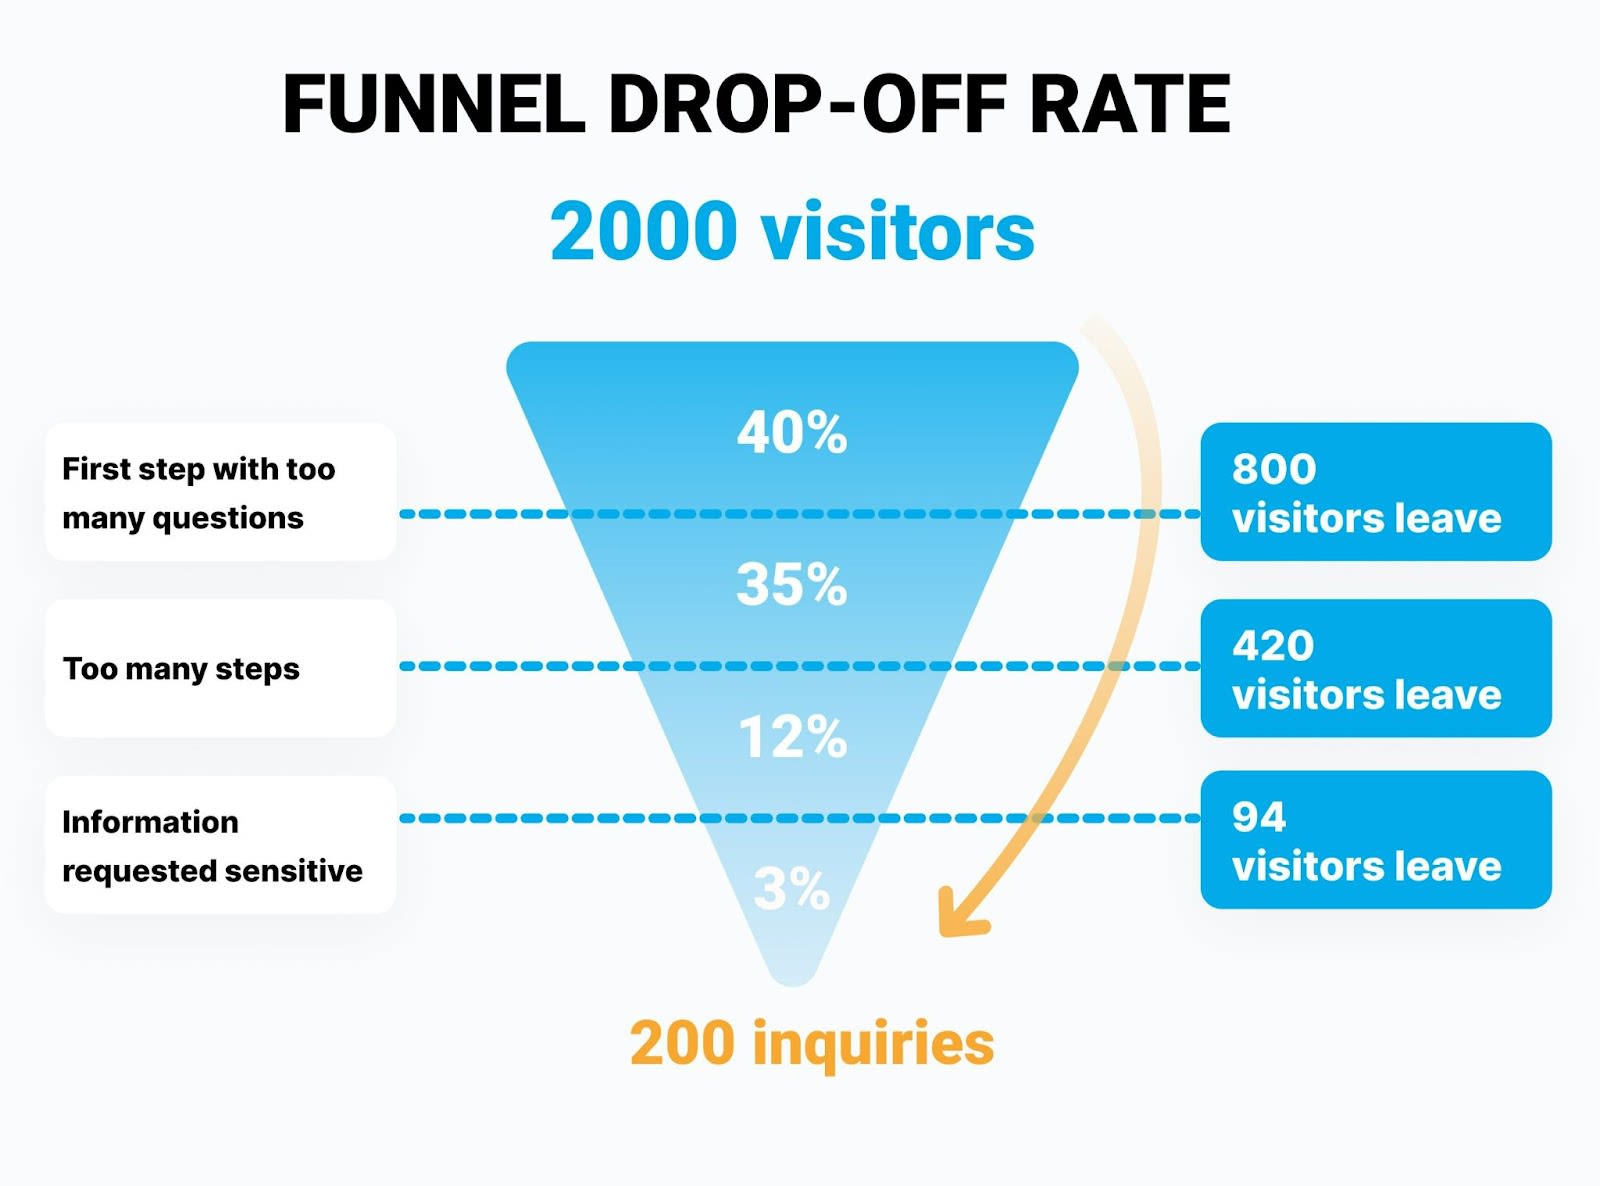
On a more granular level, analytics allows you to visualize your business products over time and identify bottlenecks in your business model.
For instance, you can see where leads are dropping off, why they’re dropping off, what’s working through attribution, and what’s not working.
Source: Arengu
Besides that, advanced marketing analytics “democratize” marketing data across your organization, and anyone in your company can basically have the power of marketing analysts or data scientists.
You can do this all without having to deal with massive business administration costs.
In other words, you don’t have to wait in a breadline for your data, and you’re supplied with everything you need to make better decisions in your marketing efforts.
Marketing Analytics Benefits
As for specific benefits, here are some of the biggest:
- You can objectively assess the performance of your website, sales funnel, social media marketing, and more.
- You gain in-depth insights into the customer experience and customer behavior.
- It allows your marketing department to make data-driven decisions, rather than “relying on a hunch.”
- You can understand overarching trends and patterns using marketing science
- It enables you to better prioritize your marketing campaign so you’ll know which areas most demand your attention.
And as you accumulate more data over time, your marketing efforts should “crystallize” where you’ll understand how everything fits together to better serve your customers and fuel growth.
Whether you’re a small startup just getting your feet wet or an international business with thousands of customers, marketing analytics can help you take the next step forward.
Data Collection and Analysis
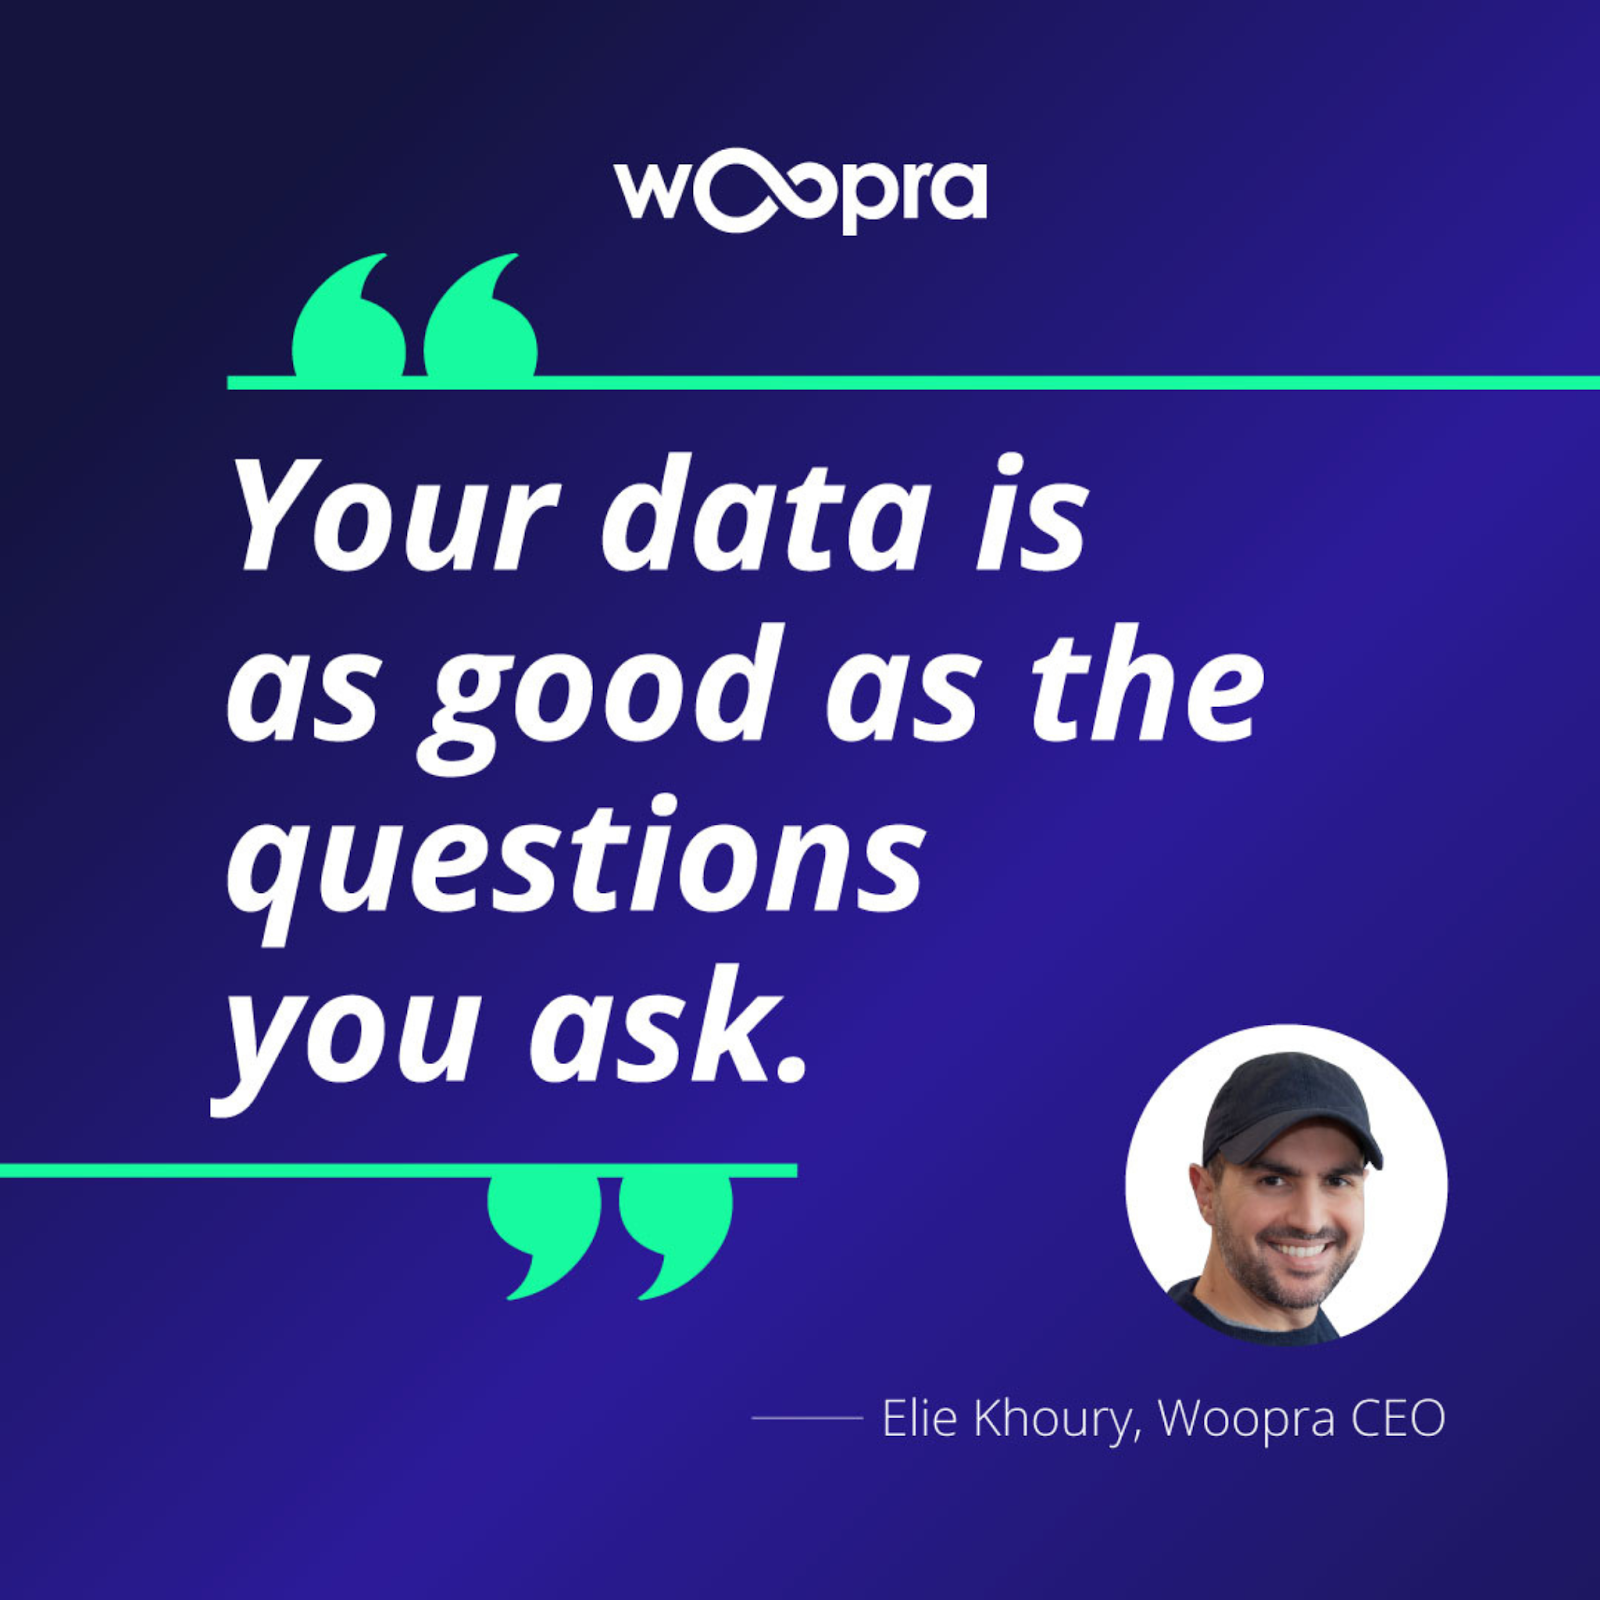
Woopra CEO Elie Khoury points out that, “Your data is as good as the questions you ask.” What questions are you asking?
So let’s go a bit deeper into the nuts and bolts of the data collection, marketing research, and data analysis process.
Marketing data can be collected from a wide variety of sources at every touchpoint in the customer journey marketing process.
Here are some examples:
- A business homepage
- Landing pages
- Product pages
- Referring sites
- Search engines
- Social media accounts
- CRM
- Marketing automation platform
By gathering data from multiple sources like these, analytics then “crunches” it through machine learning to gain a holistic understanding of how every touchpoint impacts the customer experience so you can identify strengths and weaknesses.

Syncing marketing technology platforms to unify data access is key
In turn, you’ll know what needs improving. And for areas where you’re thriving, you’ll know what to double down on to fuel growth and increase customer retention.
Here are some examples of questions you can find answers to with end-to-end marketing analytics like Woopra.
- Which marketing channels are resulting in the most signups?
- What types of content marketing are getting the most engagement?
- How successful are your retargeting efforts?
- How much of an impact does live chat have on conversions?
Common Marketing Analytics Metrics
Again, because of the versatility of this data science, the areas you can measure truly run the gamut.
But here are some of the most common metrics marketers look at.
- Click-through rate - The number of times prospects click on a link, ad, website, etc. compared to the total number of impressions.
- Bounce rate - The percentage of leads that land on your website or landing page and immediately leave (a high bounce rate usually indicates there’s an issue that needs to be fixed).
- Social media engagement - This can include impressions, views, likes, comments, and shares that lend actionable insight into marketing performance.
- SQLs vs. MQLs - The ratio of sales-qualified leads that are ready for a sales conversation vs. marketing-qualified leads that still need nurturing.
- Conversion rate - The number of people that complete a particular action such as signing up for a free trial or a paid product.
- Cost-per-click - How much it costs in dollar amount to get a prospect to click on a paid ad. (The average CPC for Google Ads, for example, is $2.69 for search and $0.63 for display).
- Cost-per-lead - How much it costs to generate a lead for a particular marketing channel.
- Cost-per-acquisition - How much it costs, on average, to convert a lead into a customer.
Common Marketing Analytics Challenges
Up until this point, we’ve discussed the pros of marketing analytics. But what are some of the cons?
One of the biggest is the amount of data that’s generated with an analytics tool can be overwhelming, especially if you’re using an advanced product. When you combine data from web analytics, sales analytics, and social media marketing, it can create “data overload” for some marketers and analysts.

Source: Adverity
Data platform company Adverity found in their 2022 survey that “too much time and manual effort [is] needed wrangle data for reporting”. They found this to be the #1 marketing analytics challenge.
Additionally, the learning curve that naturally comes along with implementing a new marketing analytics tool. No matter how tech-savvy your team may be, it takes time to fully understand the features, and there can be some hiccups during the initial stages.
There’s also the issue of not fully understanding how to evaluate the data and apply the findings. Say, for instance, an analytics tool generates a high volume of insightful data, but it’s unintuitive and you struggle to identify patterns and trends.
This is why most marketers benefit from using visual-centric analytics that allows you to see the big picture (this is a big reason why Google Analytics is so popular).
Finally, some teams find their data stuck in “silos” where a platform doesn’t integrate with other software they use (like a CRM or Google Sheets) or it’s difficult to share insights with other team members.
Implementing Marketing Analytics Software
1. Create the Customer Profile
Getting the most from analytics starts with creating a “360-degree profile” from the first touch to the last touch.
With Woopra, for example, marketers can build a comprehensive profile for all users in real-time.
Not only can you sync customer data and track activity from your site and mobile app, but you can also do it from every touchpoint in the customer journey, including text, email, live chat, and support.
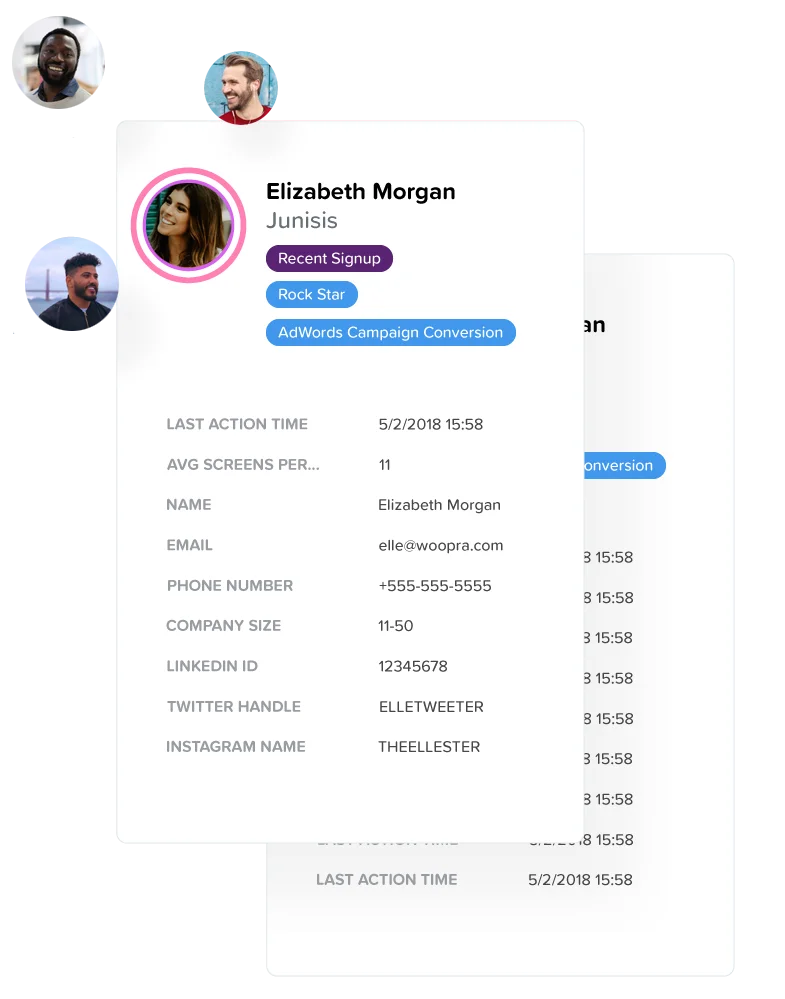
A unique capability of Woopra is that it lets you track the user anonymously at first. Then, you can retroactively track them after you have a conversion or ID data.
This, in turn, gives you a clear picture of the customer profile from the very first interaction to the moment they convert and beyond.
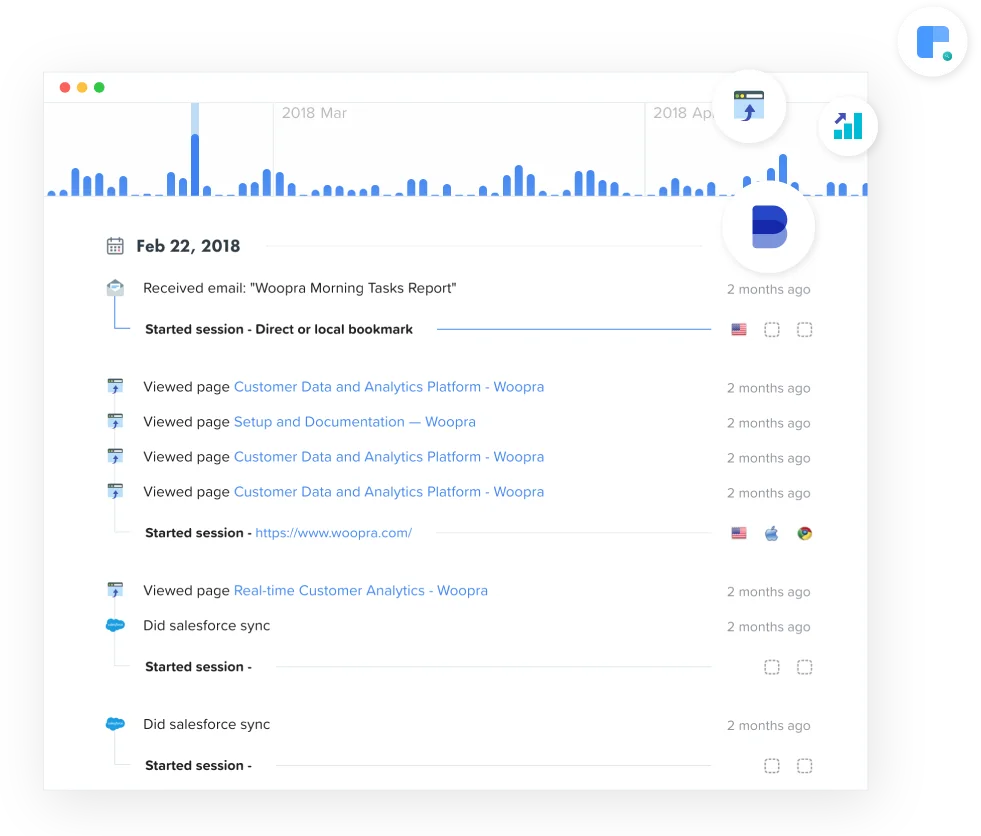
By having this type of complete data, you can then tailor each individual user experience to optimize fully for consumer behavior.
A good example would be sending real-time actions to your digital marketing team so they can almost instantly get the right marketing materials to each prospect (e.g. sending targeted content to address their specific pain points).
2. Track and Measure Everything
As I said before, data overload is a real thing for marketers, and it can be tricky to wrap your head around a ton of different metrics.
That said, the more aspects of your marketing campaign you analyze, the clearer your understanding of how everything fits together.
While you don’t want to go overboard to the point that it hurts your bottom line, it’s important to track and measure everything that affects the customer journey.
So the more comprehensive you are with this, the better the outcome should be.
Also, as I mentioned earlier, a common challenge for many marketers is having difficulty interpreting data and applying the findings, which is where having intuitive information systems comes into play.
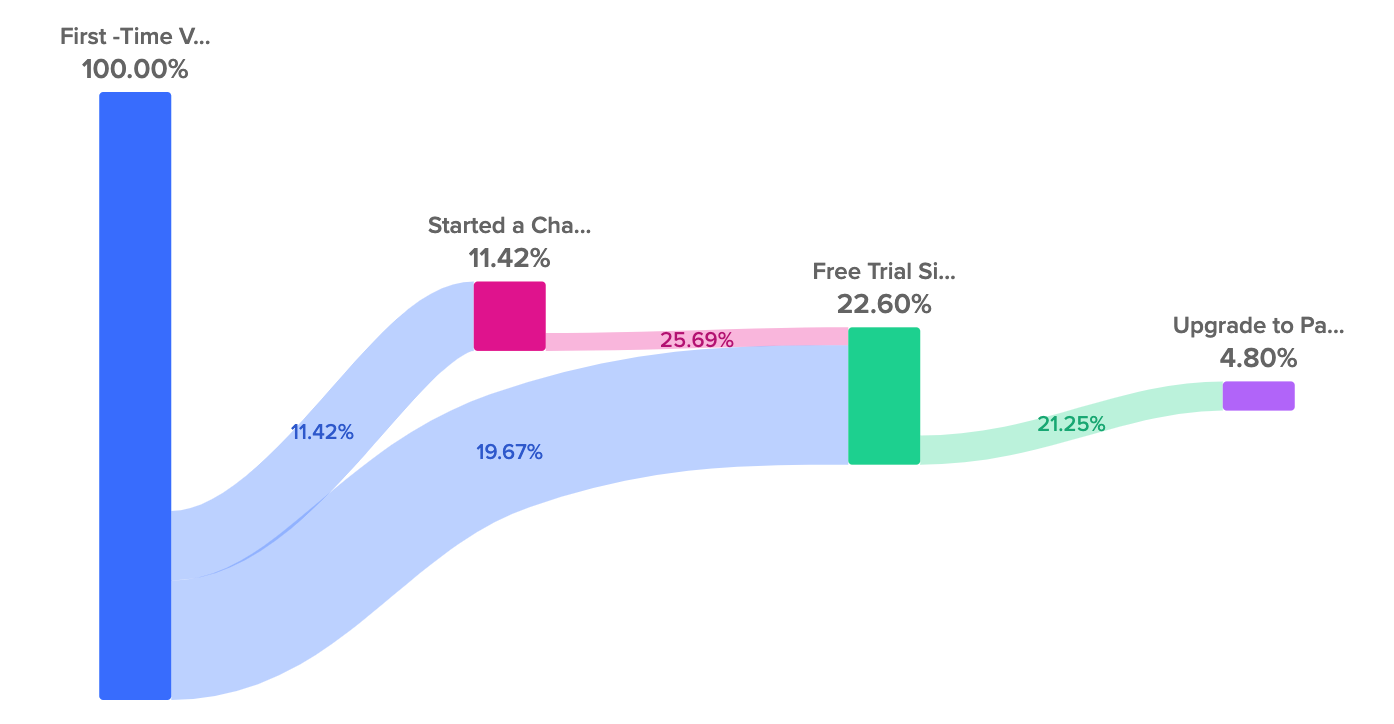
A key feature of Woopra is profile metrics, which use scoring and customer intent to provide you with quantifiable data to determine where someone is at in the customer journey and which leads to prioritization.
For example, a good starting point could be figuring out what percentage of users you convert from Google Ads.
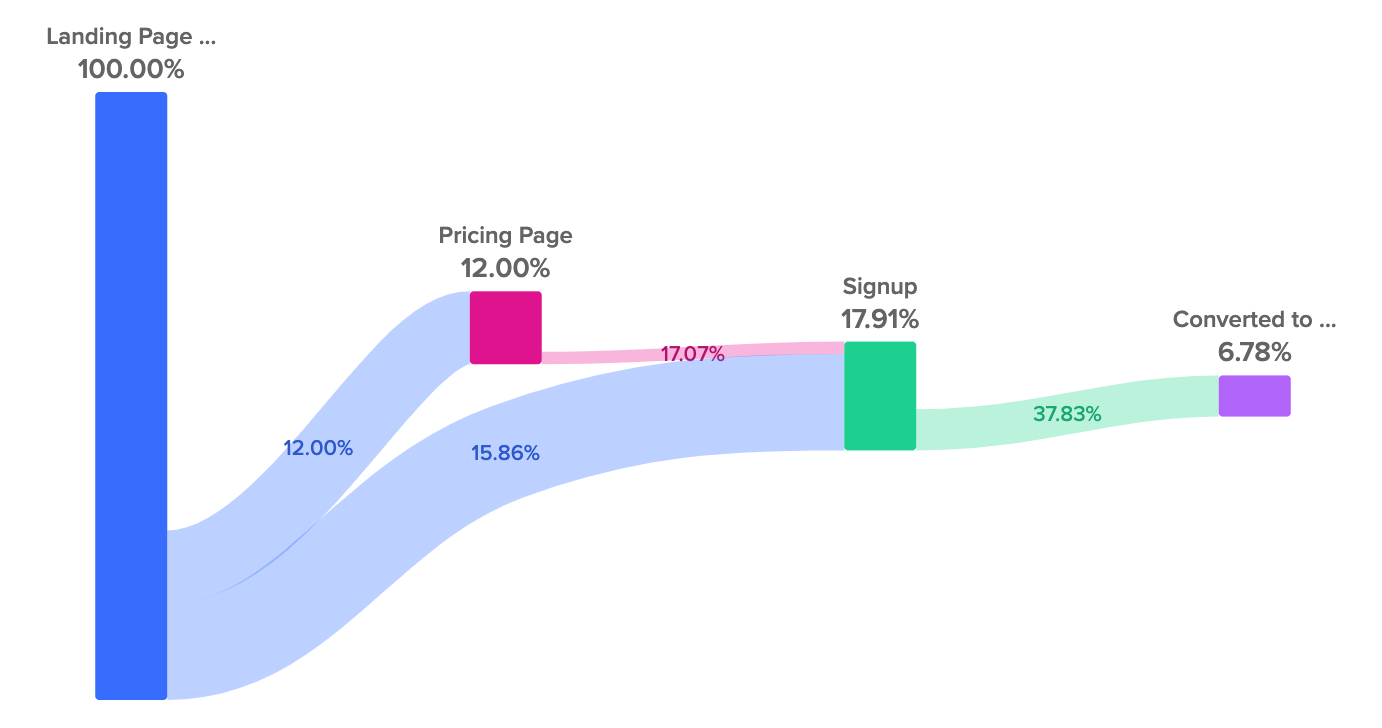
Or, you could see how live chat impacts your conversions to determine if that’s a potential stage in the customer journey to push digital marketing materials.
3. Personalize Your Marketing
Finally, you’ll want to use the insights gained from your marketing analytics software to personalize your marketing strategy.
There are two main aspects to personalization.
One is keeping your team in the know and avoiding siloing so they can fine-tune messaging and offers.
The other is automating personalization for your customers by giving them the right content at the right time, effectively using sales notifications, retargeting, and so on.
You can think of Woopra as being the “brain of the data” where it analyzes information and dispatches actions to the appropriate team members and tools.
If, for example, a prospect showed an interest in a particular product, they could receive an automated marketing message that focused on that product.
By creating a highly personalized customer experience and leveraging marketing automation, your conversion rate and ROI can’t help but improve.
Closing Thoughts
With over half of the marketers that use analytics seeing above-average profits, it’s clear that the potential impact is real.
It’s just a matter of fully grasping business analytics, overcoming common obstacles, and knowing how to implement it properly.
Get that right, and you’ll know who your customers are, what motivates them, and how to get them to come back.
Check out the other articles in our Marketing Analytics series:
- The 3 Types of Marketing Analytics
- The Best Marketing Analytics Tools
- The Essential B2B Marketing Analytics Guide


