The better your data, the better your marketing performance. It’s that simple.
That’s your ticket to understanding customer behavior, fine-tuning your campaign, and maximizing ROI.
Here, we’ll explain how to measure your marketing campaign analytics, specific metrics to focus on, and strategies for optimizing both eCommerce and SaaS performance.
What is Marketing Campaign Analytics?
Marketing campaign analytics refers to evaluating the data from your website, social media, paid ads, and any other channel that’s part of your marketing campaign to better understand the customer journey.
You then leverage this data to identify strengths and weaknesses and determine potential areas for improvement to enhance all aspects of the customer journey.
By making continual iterations based on the marketing data you generate, this helps fuel growth, increase customer retention, and ultimately boost revenue.
Note that marketing analytics is a broad term, and the exact way marketers approach it can vary.
But regardless of the specifics, the end goal is to visualize and optimize every step of the customer journey.
If, for example, you were wondering which marketing channels were resulting in the most signups, you could use a marketing analytics platform like Woopra to objectively see this.
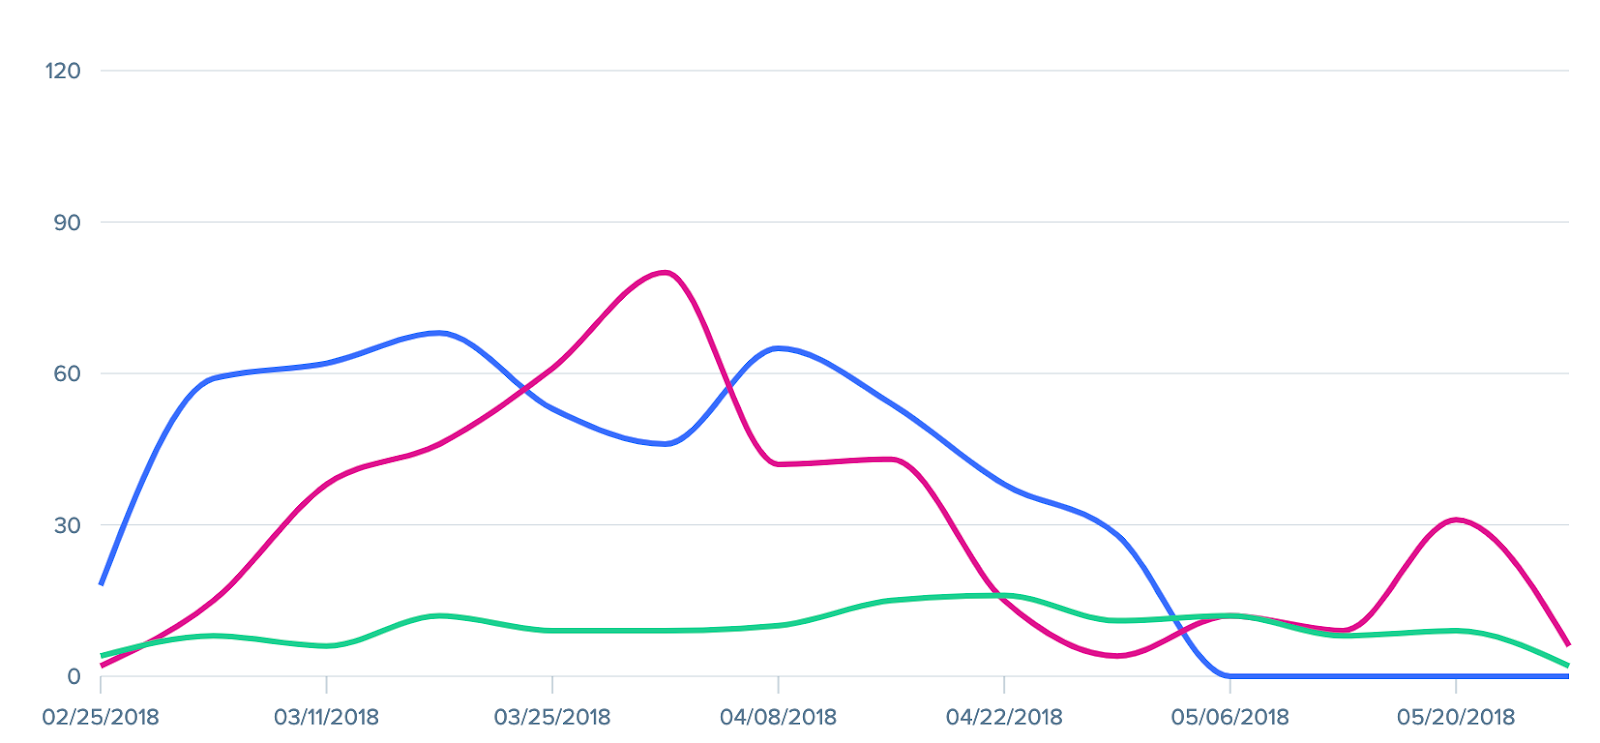
One of the best parts about a marketing analytics tool is that it democratizes knowledge, where all stake holders in your organization can make data-driven decisions without having to know an ounce of coding.
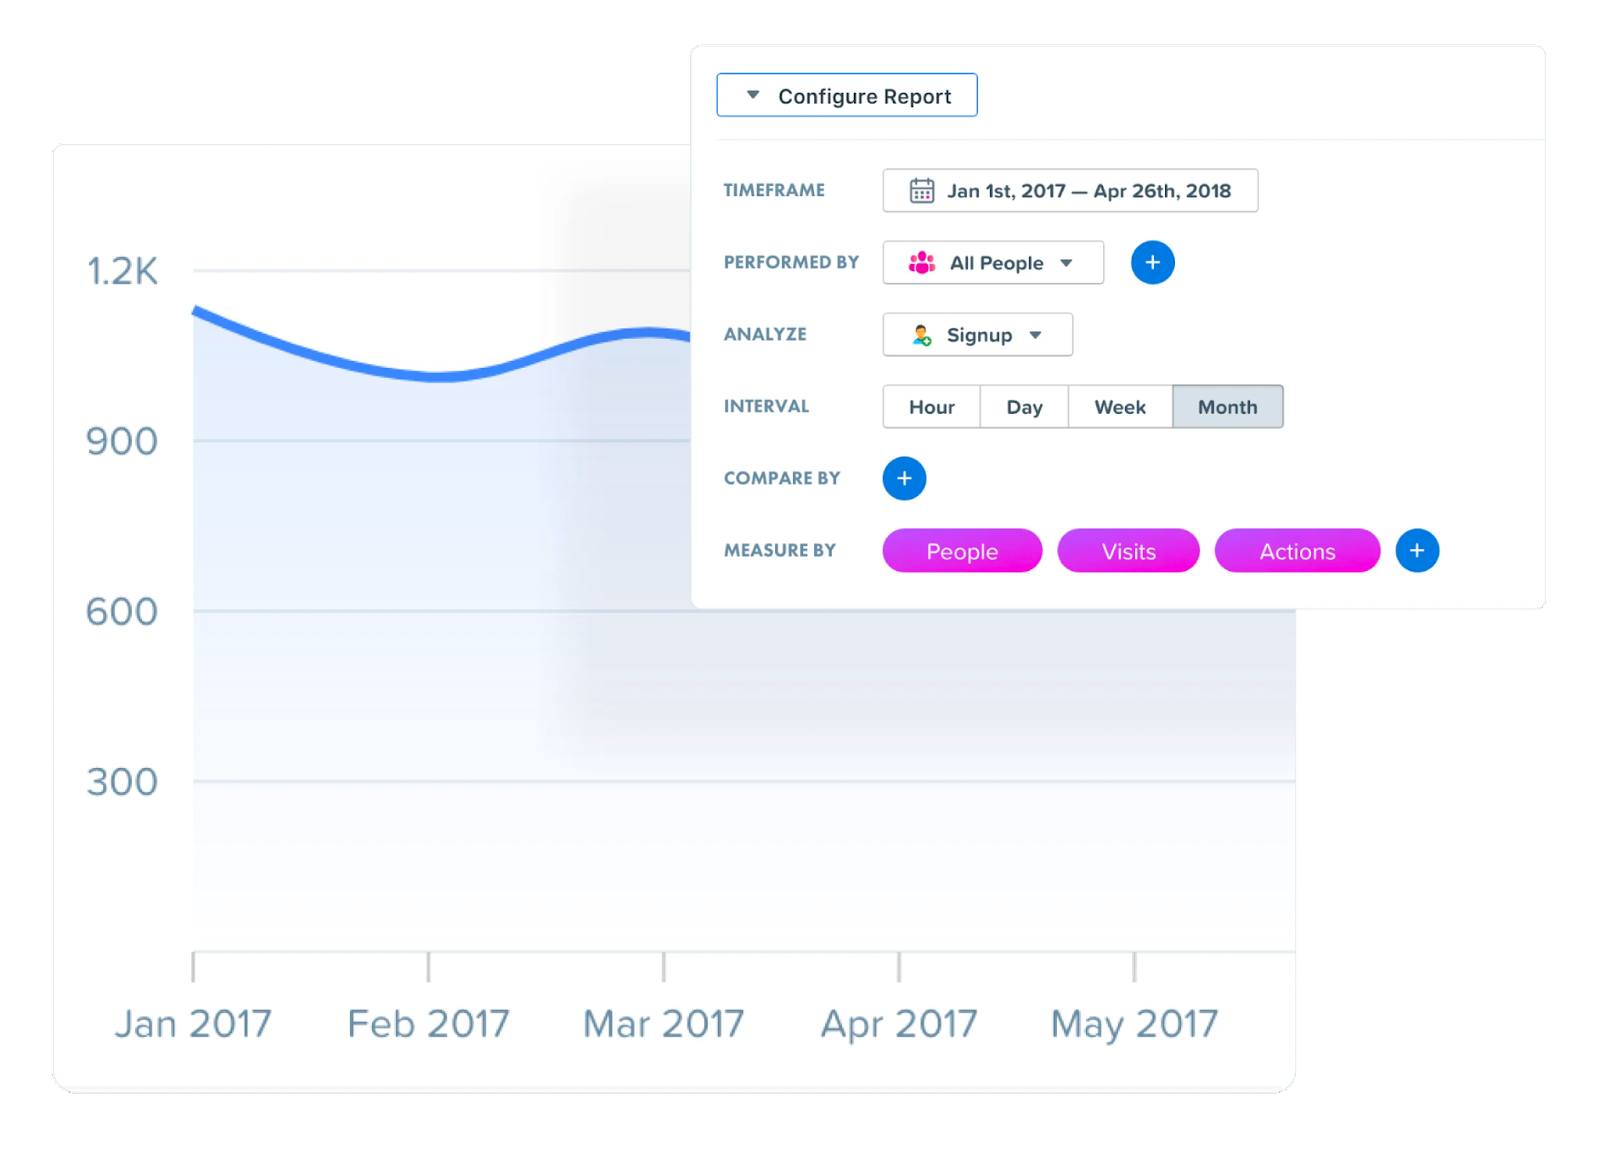
With marketing data siloing being one of the biggest barriers to marketing analytics, a platform like Woopra is helpful because it gives marketing teams a comprehensive picture of what’s happening to make more accurate predictions.
That way you can comprehensively track marketing campaigns from end-to-end for a clear view of customer behavior, marketing attribution, and more to drastically increase your odds of building a successful campaign.
How to Measure Your Campaign’s Performance
Now let’s dive into the nuts and bolts of how to measure marketing performance step-by-step.
Set KPIs for Your Marketing Campaign
A critical precursor to everything else is clearly defining key performance indicators (KPIs).
Common KPIs include:
- Revenue
- ROI (Google ad, digital marketing, email marketing, etc.)
- Number of leads
- Customer acquisition cost
- Social media marketing engagement
- Social media follower growth
- Organic search traffic
- Referral traffic
Articulating KPIs will help lay the foundation for your marketing analytics and provide valuable direction for your marketing team.
Also, note that you can’t tackle everything at once, so you’ll want to decide which KPIs to prioritize first.
After generating marketing data for your most pressing KPIs, you can branch out later for a more holistic perspective.
Know What Success Looks Like
Next, you need to figure out what metric numbers you want to hit.
Going back to some of the examples we just mentioned, this could include:
- How much revenue you’re looking to reach
- What ROI you’re going for
- The number of leads you want to generate
- How much organic search traffic you want
- And so on
By determining what success looks like beforehand, marketers can set tangible goals, which is vital for creating a winning marketing campaign.
Identify Campaign Measurement Tools
Marketing analytics tools can include the Google Ad or Facebook Ad platform, your email platform, your website analytics platform, or any other analytics tool that will be instrumental in generating data.
If, for instance, two of your primary marketing channels are Google Ads and organic Google search traffic, Google Analytics has useful integrations for syncing all of these campaigns.
But Google Analytics also has limited options for targeting individuals and cross channel integration with non-Google platforms.
If you want end-to-end data analytics to see how users move from your website through your marketing campaigns to your product, you can use a platform like Woopra, which offers multiple types of marketing analytics, including descriptive, prescriptive, and predictive analytics to gain a wide array of actionable insights.
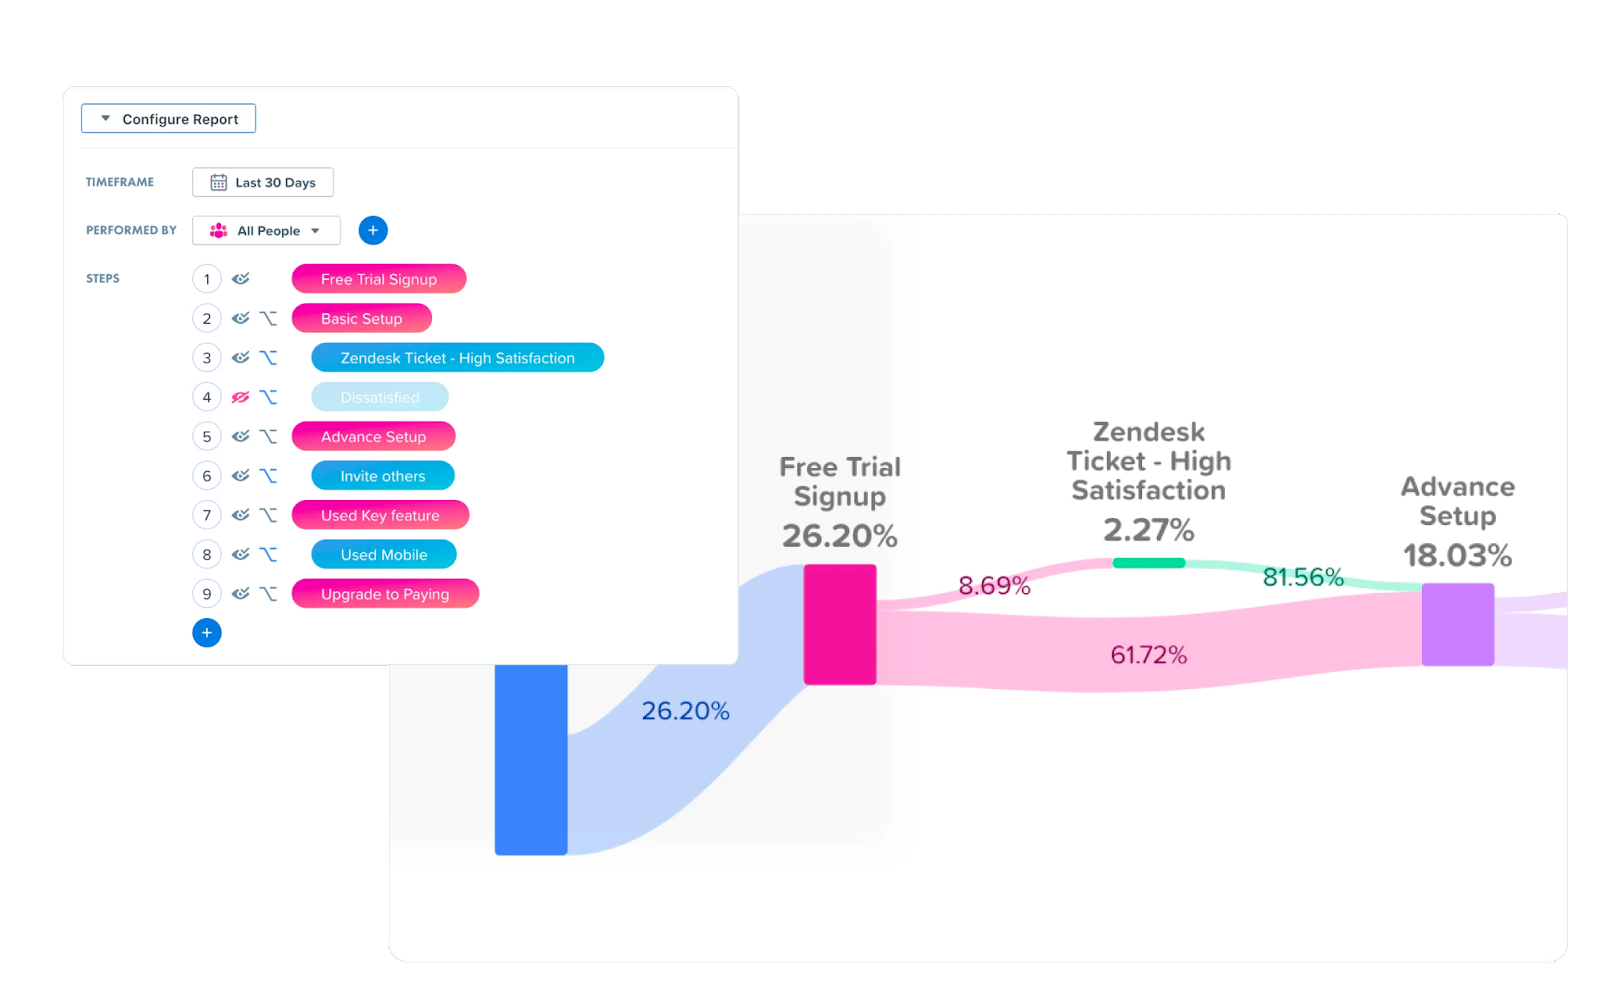
If you’re looking for detailed insights for more data-driven marketing that optimizes every touchpoint of the customer experience, Woopra is an excellent option.
Use UTM Parameters
Short for Urchin Traffic Monitor, UTM parameters are pieces of code that are added to the end of links to accurately track clicks and look something like this.
utm_source=google&utm_medium=display&utm_campaign=spring-release&utm_term=rugs&utm_content=help-guide
By using UTM parameters, you can generate detailed advertising campaign insights and get data on conversions, traffic sources for attribution, and ROI.
In terms of what you can track, there are five main types of UTM parameters.
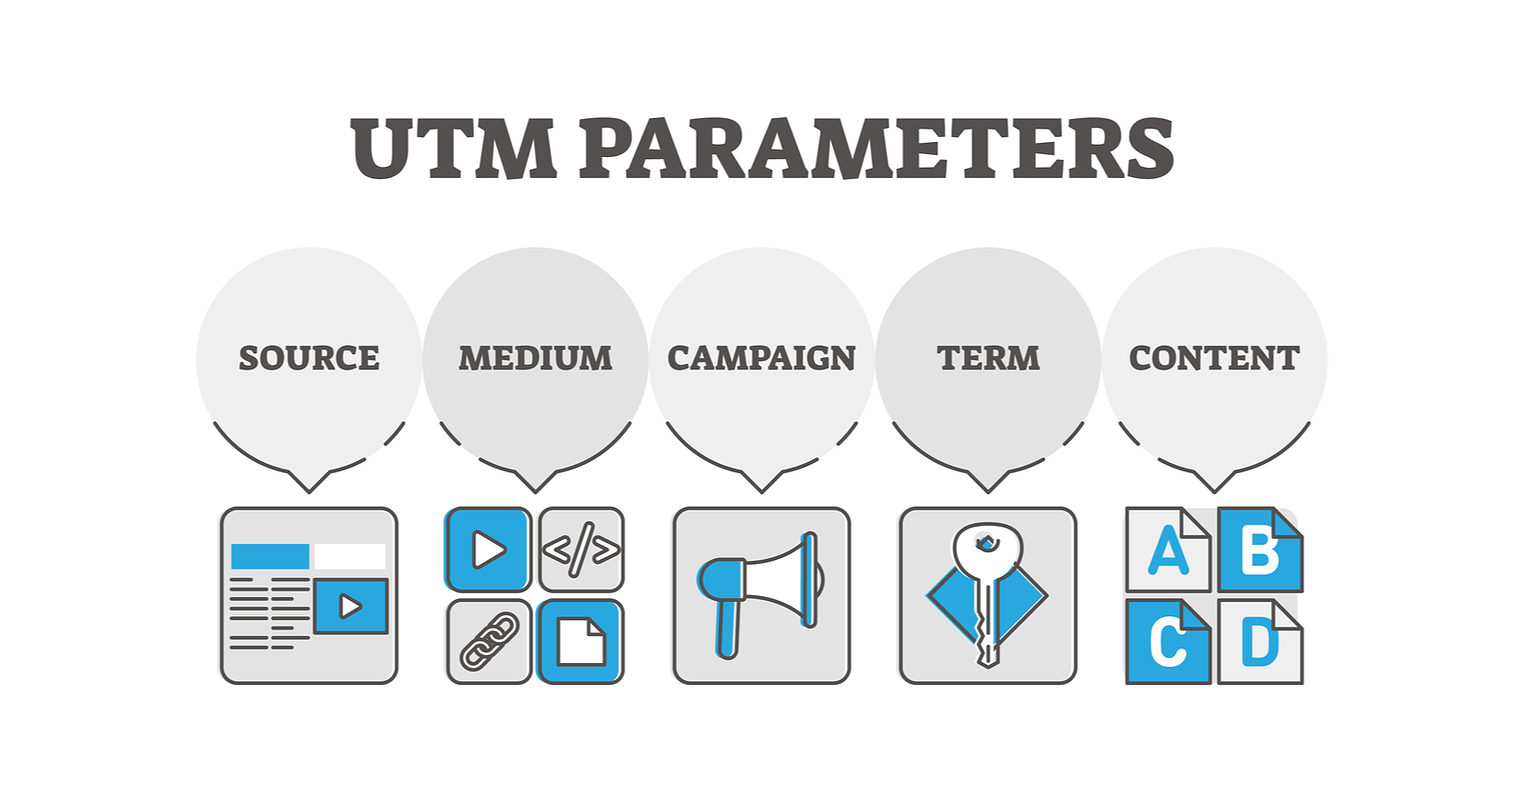
Source: Search Engine Journal
For example, source will tell you the digital location a user came from, and medium will tell you what Google ad, social media post, video, email, and so on led to generating a lead.
Pick Your Attribution Model
Another critical part of marketing analytics is determining which touchpoint should be credited for a conversion.
Known as attribution modeling, this lets you know which marketing channel or channels are resulting in the most conversions so you’ll know where to spend more time and money for future campaigns.
Further, an attribution model can show marketers where to spend less time and money, along with general improvements that can be made to enhance the customer experience.
With first-click attribution, the very first channel a customer engages with is given credit for a conversion (say they initially clicked on a Google ad, for example).
With last-click attribution, it’s the opposite where the last channel receives credit (the customer initially clicked on a Google ad but later clicked on a retargeted Facebook ad, which ultimately led to the conversion).
Or, you can take a blended approach that looks at both views and clicks to see the big picture.
Look for Missed Conversions
Again, marketing analytics is a highly iterative process.
Following the steps up to this point should provide your marketing department with a lot of actionable data, but there will likely be missed conversions.
So you’ll want to see what conversions went untracked and also look for spikes in other marketing channels to spot potential opportunities you haven’t yet capitalized on.
This brings us to our next point.
Identify Ways to Improve
No matter how successful and streamlined your marketing campaign becomes, there’s _always _room for improvement.
If, for instance, you identify friction points in the customer journey that are preventing more prospects from moving from reading your marketing content to your free trial signup, you would want to fix them.
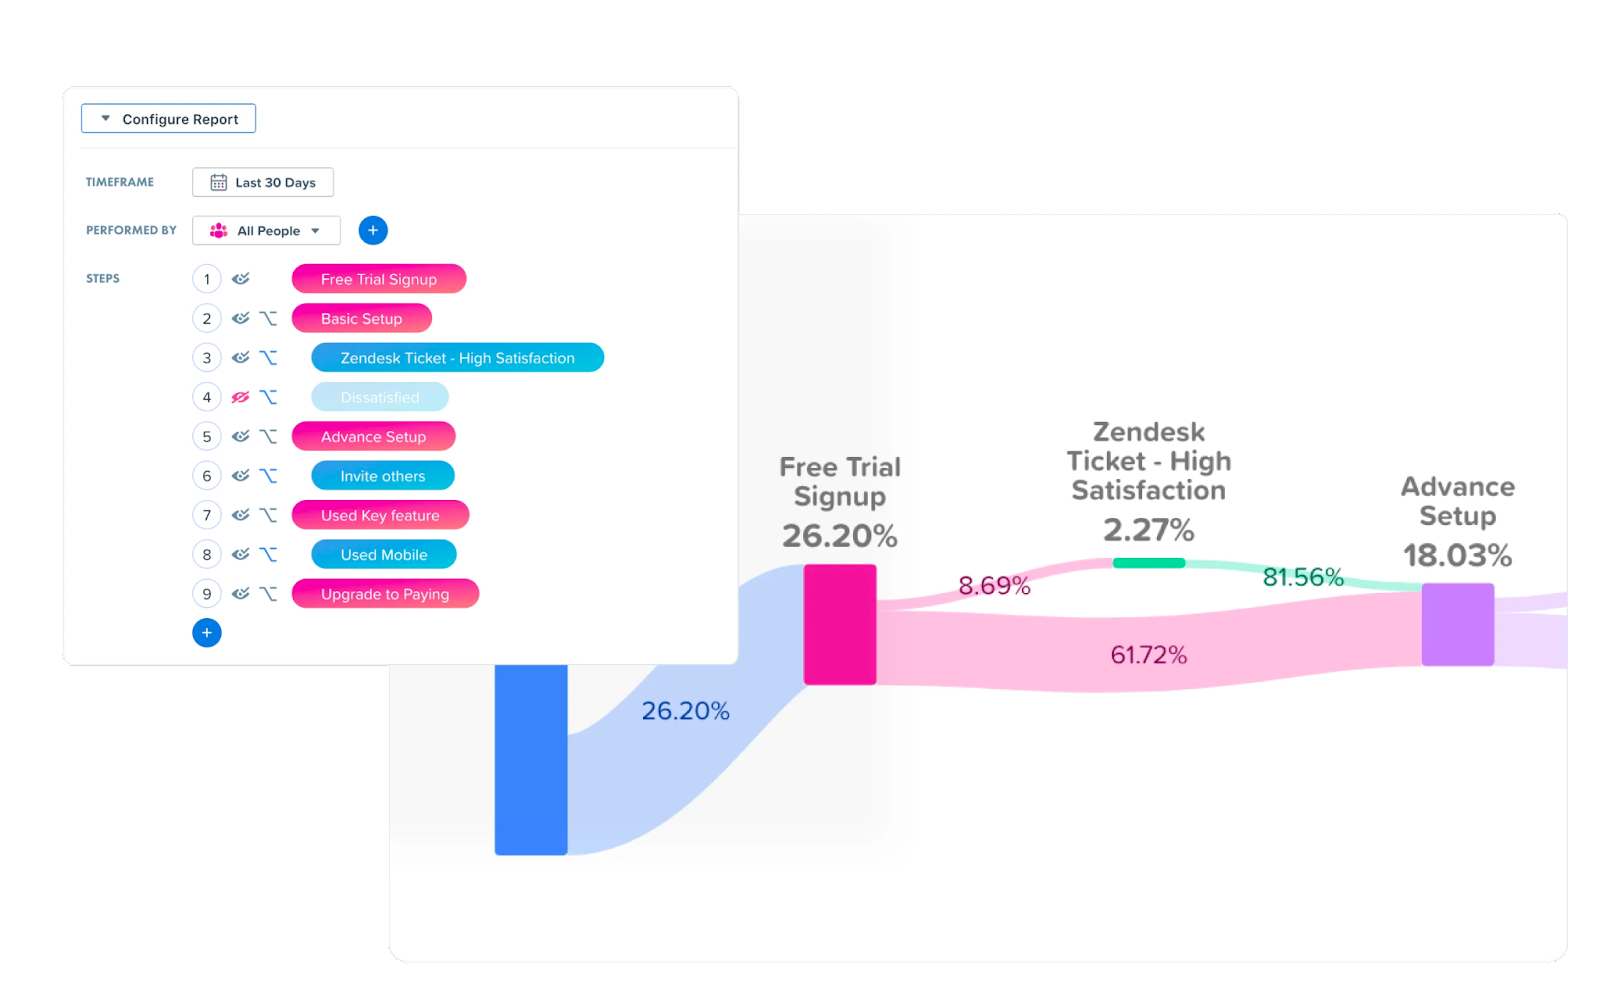
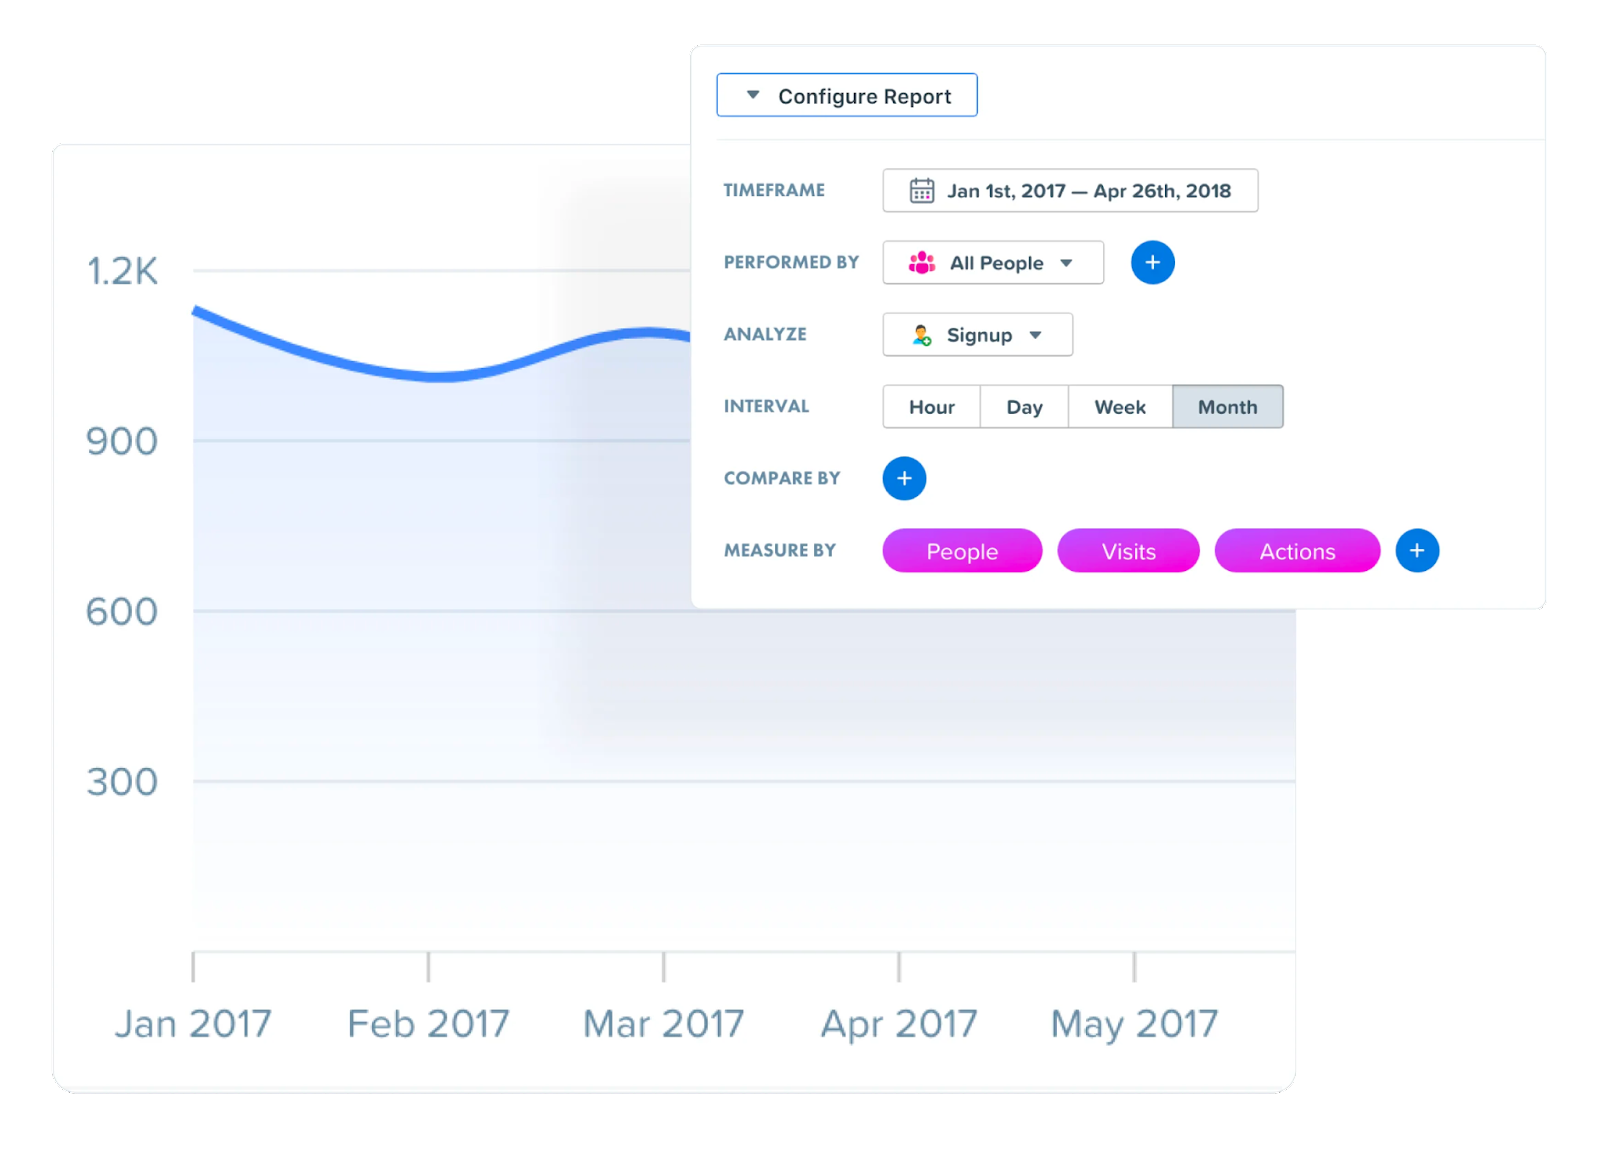
And as you generate more data over time through long-term trends reports, be on the lookout for adjustments you could make to improve core KPIs like ROI and revenue.
Consider A/B Testing for Iteration
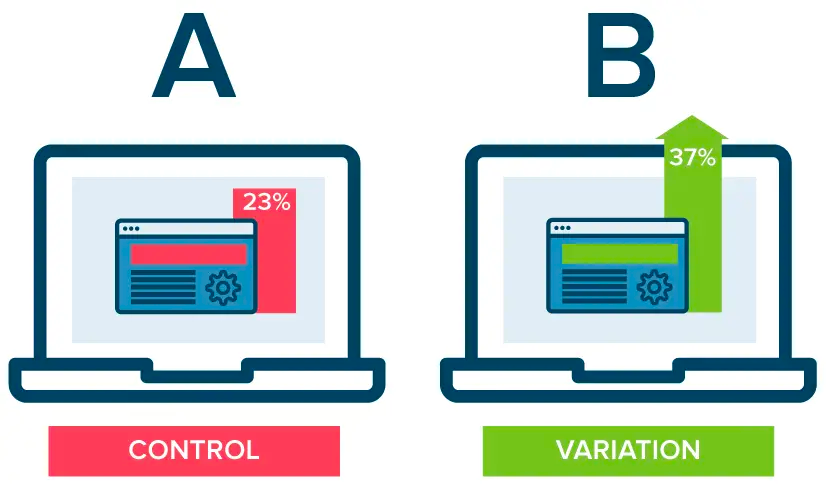
Finally, A/B testing (also known as split testing) where you compare two variants side by side to determine which has the better performance can be extremely helpful for making data-driven iterations.
A simple example would be experimenting with two versions of a marketing ad to see which one has the higher conversion rate.
Source: Optimizely
If the conversion rate of the variation was considerably higher like it is above at 37% compared to just 23%, you would want to stick with the variation.
And there’s no end to what marketers can A/B test — everything from headers to marketing copy to CTAs and popups can be analyzed to see what works best.
We've found that testing marketing copy through message testing is one of the cheapest and easier ways to see a quick boost!
Campaign Metric Ideas
As for specific metrics to measure with marketing analytics, here are five we recommend starting with.
Website
Given this is where all the effort of marketers ultimately culminates, it demands a lot of your attention.
Key metrics to measure include:
- Total number of site visitors (unique visitors)
- Total page views
- Pages per session
- Average session duration
- Referrers (channels that brought visitors to your site)
- Bounce rate
- Conversion rate
- Most visited landing pages
- Most frequently exited pages (this can help you identify potential issues to address)
Social Media
Although social media traffic is a vital metric to track and integral to optimizing overall campaign performance.
Some of the best social media metrics to measure are:
- Impressions
- Reach
- Click-through rate
- Engagement (likes, comments, views, shares, etc.)
- Video completion rate
- Account mentions
- Virality rate
- Cost-per-click
- Conversion rate
- Audience growth
- Social sentiment
Ad Campaigns
Nearly all major social media platforms like Instagram, YouTube, and Facebook offer paid ad campaigns that can greatly increase the reach of your digital marketing.
Metrics to analyze here include:
- Cost per thousand impressions (CPM)
- Click-through rate
- View-through rate (for video ads)
- Conversion rate
- Cost-per-click
- Cost-per-view (for video ads)
- Audience growth
SEO
Here’s what to measure:
- Organic traffic
- Top ranking keyword positions
- Impressions
- Clicks
- Click-through rate
- Conversion rate
- Backlinks and referring domains
- Number of pages indexed
- Average position (where your site compares against competitors)
Note that Google Search Console is usually a good starting point for SEO metrics, but other tools like Woopra can provide marketers with more robust analysis.
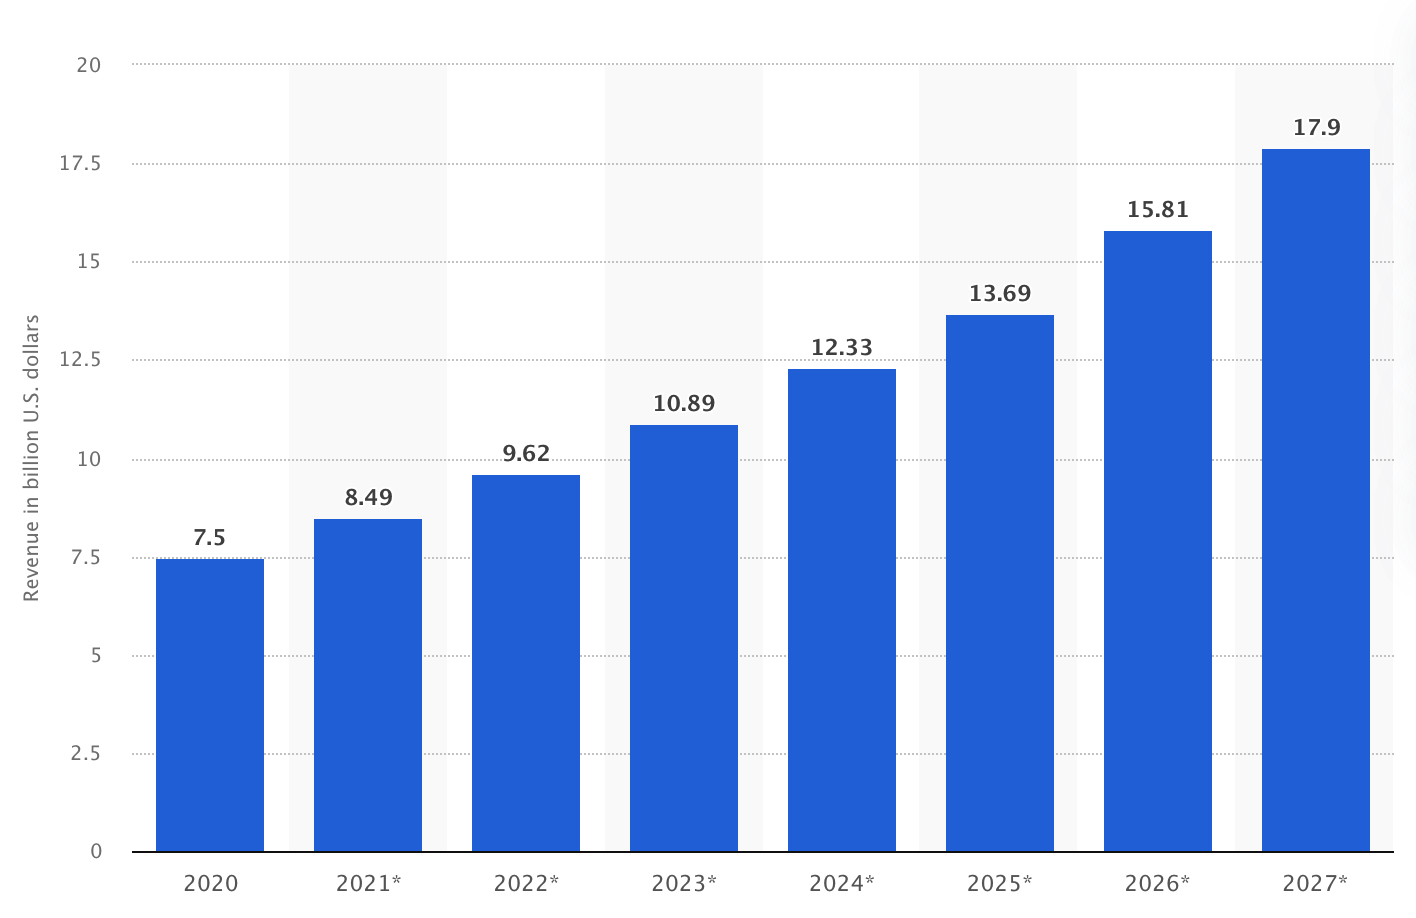
Although email may not be as sleek and cutting-edge as many other digital marketing strategies, it still gets big results, with the overall revenue expected to increase over the next several years.
Source: Statista
Key metrics to measure are:
- Open rate
- Click-through rate
- Conversion rate
- Bounce rate
- Email sharing
- Churn rate
- Email list growth
- ROI
eCommerce Campaign Considerations
For the last part of this post, I’d like to point out the differences between using marketing analytics to measure campaign performance for eCommerce versus SaaS.
eCommerce is fairly straightforward for marketers. You simply measure purchases and revenue and then use these numbers to calculate the total ROI of your marketing strategy.
The basic formula for making calculations looks like this.

Source: Quarticon
If, for example, you invested $20,000 into your eCommerce marketing initiative and earned $100,000 in profit, you would calculate your ROI as follows:
$100,000 - $20,000 / $20,000 x 100
And that would be 400%.
Note that there are other formulas marketers can use, but this one is a good starting point.
SaaS Campaign Considerations
SaaS campaign analysis is a little trickier than eCommerce campaign analysis, as there are more moving parts.
The best way to measure campaign performance is by integrating your CRM, marketing automation, and product analytics to get a full view of the campaign results.
Using marketing analytics software like Woopra makes this simple because of the built-in integrations it offers.
For instance, Woopra integrates with Salesforce CRM so you can conveniently track and unify customer data to gain a clear understanding of what’s working with each marketing effort.
More specifically, this integration includes the People Export and Trigger features that send Salesforce highly insightful data including intents and visit frequency.
In turn, this supplies your sales team with critical marketing data to help them prioritize more qualified leads over less qualified ones.
So rather than wasting their time reaching out to MQLs, they could focus exclusively on SQLs and let your marketing team nurture MQLs until they’re ready for a sales conversation.
Woopra also integrates with Marketo, which allows you to import a wealth of marketing data for next-level insight into your target audience to improve marketing automation.
For example, you can import email events to let you know which emails received the most opens and engagement so you can optimize future email content.
Or, you can leverage Journey Analytics to see where email subscribers are dropping off in the conversion path to avoid making the same mistakes in the future.
The Impact of Marketing Analytics
With 84% of leading marketers using some type of analytics tool, there’s no denying the power it can have.
It just boils down to knowing how to properly measure campaign performance and fine-tuning it for your specific marketing activity.
By doing so, you can understand the customer journey from start to finish, optimize all aspects of your marketing campaign, get the absolute most from each marketing platform, and dramatically boost marketing ROI.


